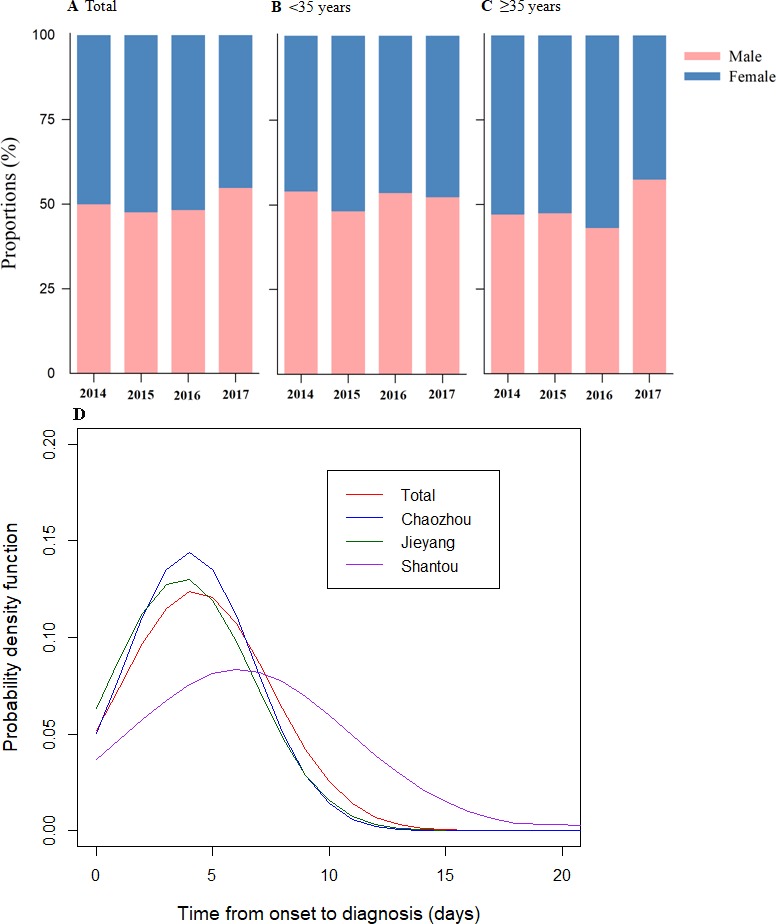
Figure 2.

Proportions of gender-specific cases of dengue fever by age groups and estimates of onset-to-diagnosis distributions of dengue fever cases in Chao-Shan area, 2014–2017. (A) Based on total cases. (B) Based on cases aged less than 35 years. (C) Based on cases aged greater than or equal to 35 years. (D) Onset-to-diagnosis distribution by city.
