
Figure 5.
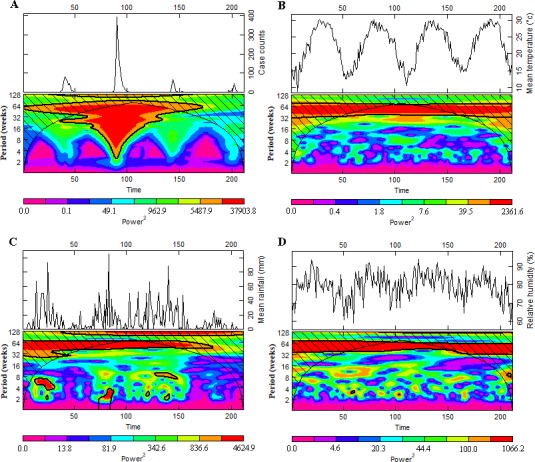
Wavelet analyses for time series of notifications of dengue and climatic variables including mean temperature, rainfall and relative humidity in Chao-Shan area, 2014–2017. Local wavelet power spectrum for dengue cases (A), mean temperature (B), rainfall (C) and relative humidity (D). Solid and bold lines indicate boundary of statistical significance.