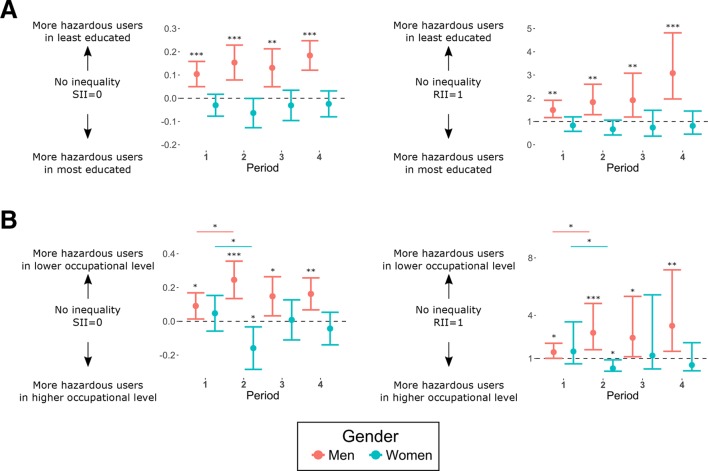
Figure 2.
Absolute (SII) and relative (RII) inequalities in hazardous alcohol consumption for men (red) and women (blue) for (a) educational attainment and (b) occupational level. Estimates and 95% CIs are presented as well as the level of significance. Wald test p values comparing indexes between groups are presented when <0.05. *P<0.05, **P<0.01, ***P<0.001. RII, Relative Index of Inequality; SII, Slope Index of Inequality.

