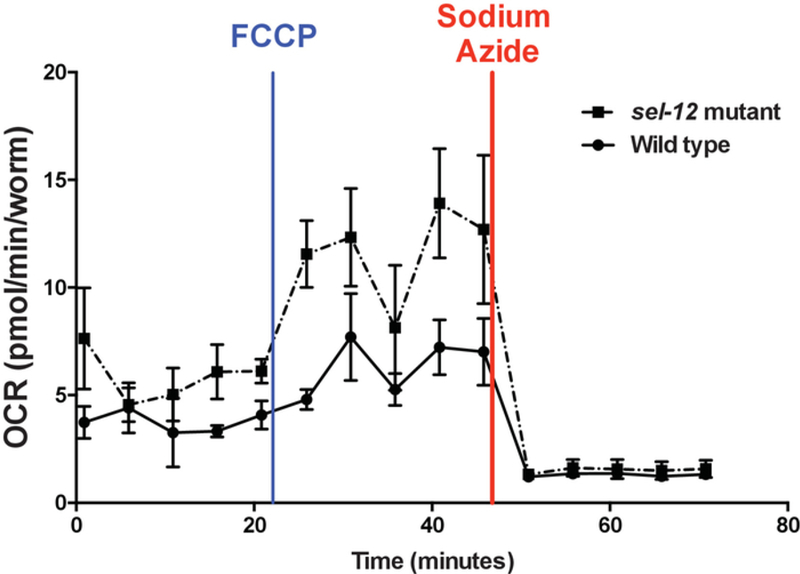
Figure 3. Characteristic OCR profile in C. elegans respirometry.

The five initial readings show the basal respiration, followed by five readings of maximal and five readings of non-mitochondrial respiration after FCCP and sodium azide injections, respectively. Error bars represent the standard error of measurement (SEM).
