
Figure 5. Maximal respiration in wild type and various sel-12 mutants.
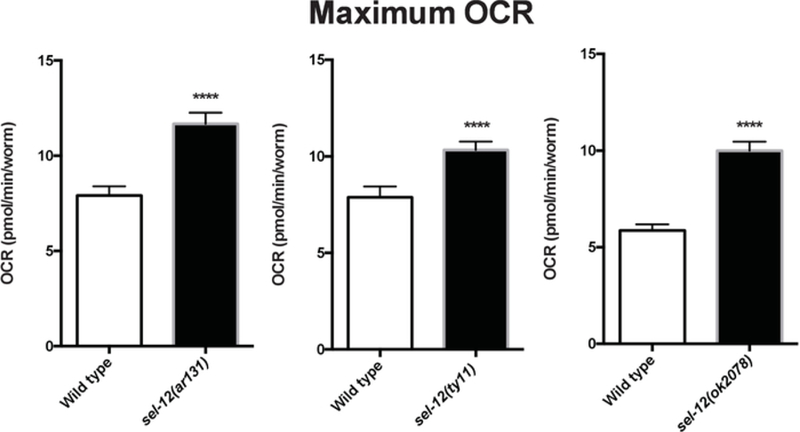
Average maximal respiration in Day 1 adult age-matched wild type and sel-12 mutant animals after FCCP injection. Data compiled from three assay repeats. Error bars represent SEM and **** indicates p <0.0001. p values were calculated using a two-tailed t-test.