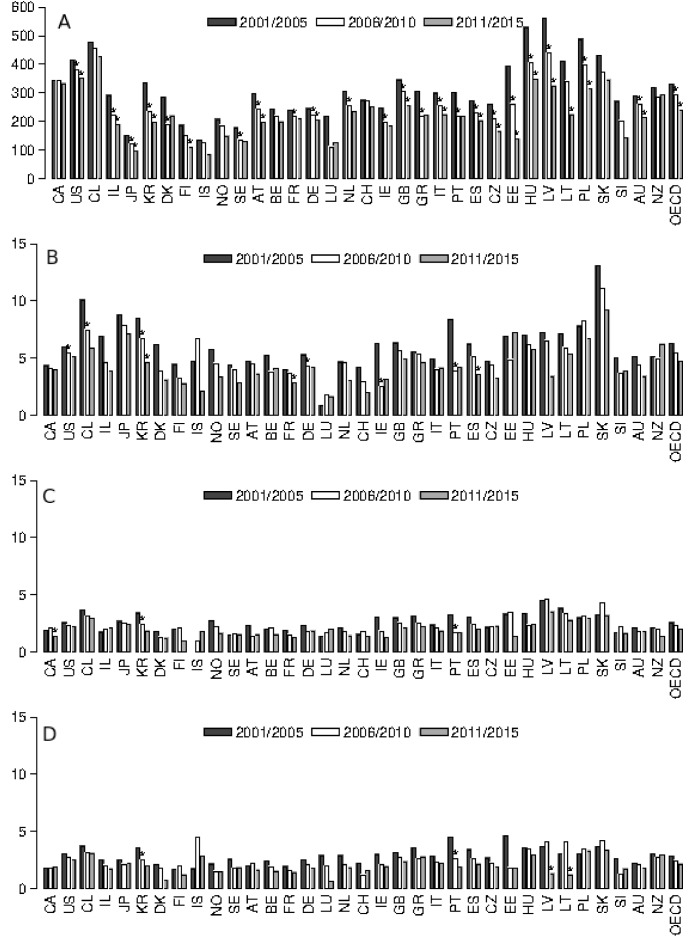
Figure 1.
Yearly amenable mortality rates (per 100 000) for ages <1 (A), 1–4 (B), 5–9 (C) and 10–14 (D) in 34 Organisation for Economic Co-operation and Development countries, 2001/2005, 2006/2010 and 2011/2015 (see online supplementary file 1 for country-level data availability). *Percentage decrease is statistically significant (p<0.05). AT, Austria; AU, Australia; BE, Belgium; CA, Canada; CL, Chile; CZ, Czechia; CH, Switzerland; DE, Germany; DK, Denmark; EE, Estonia; ES, Spain; FI, Finland; FR, France; GR, Greece; GB, UK; HU, Hungary; IL, Israel; IS, Iceland; IE, Ireland; IT, Italy; JP, Japan; KR, Republic of Korea; LT, Lithuania; LU, Luxembourg; LV, Latvia; NL, The Netherlands; NO, Norway; NZ, New Zealand; PL, Poland; PT, Portugal; SE, Sweden; SI, Slovenia; SK, Slovakia; US, USA.

