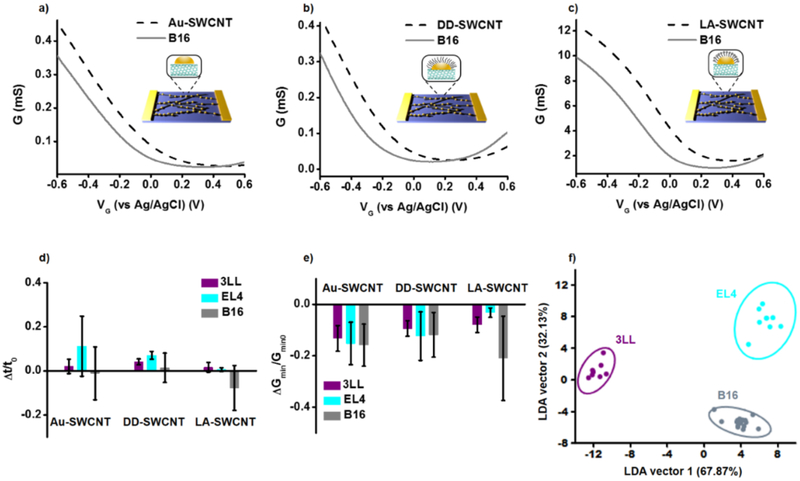
Figure 2.
G-Vg curves, statistics, and LDA response to cancerous cell cultures. a-c) Characteristic NTFET curves for bare gold (Au-SWCNT), dodecanethiol (DD-SWCNT), and lipoic acid (LA-SWCNT) devices and their respective response to B16 melanoma. d-e) The average relative change in transconductance and minimum conductance (parameters 1 and 11 in Figure 1b, respectively) to 3LL, EL4, and B16 cell lines. Error bars represent one standard deviation. f) LDA result of all data collected for the three cancer cell lines condensed into the two canonical vectors which give the maximum variance in the data. Ellipses represent 95% confidence intervals.

