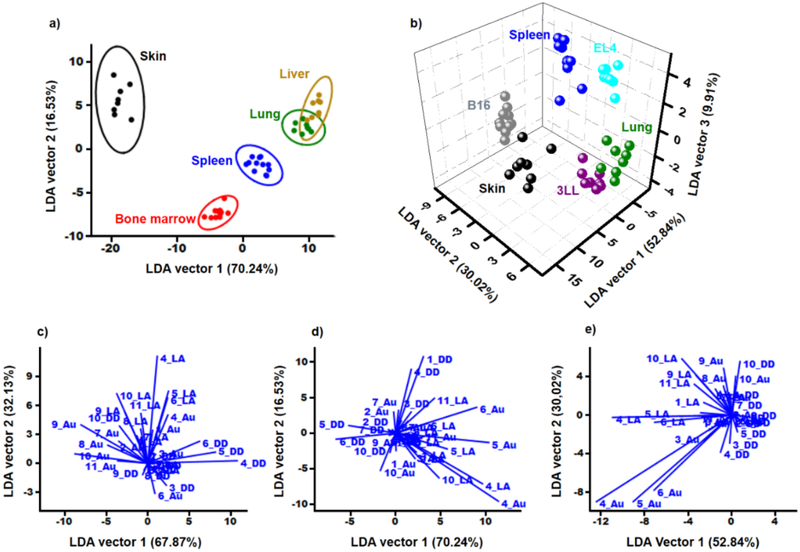
Figure 3.
Linear discriminant analysis of healthy tissue versus cancer cells. a) LDA analysis of cells from healthy murine tissue samples. The first two canonical vectors explaining over 86% of variance in the data. Ellipses represent 95% confidence intervals. b) LDA results of healthy murine cells and their malignant counterparts lines: skin and B16 melanoma, spleen and EL4 lymphoma, lung and 3LL carcinoma. c-e) Biplots graphs showing the loadings vectors of each characteristic for cancer cell lines c), healthy murine tissues d), and healthy murine cells and their malignant counterparts cell lines e.

