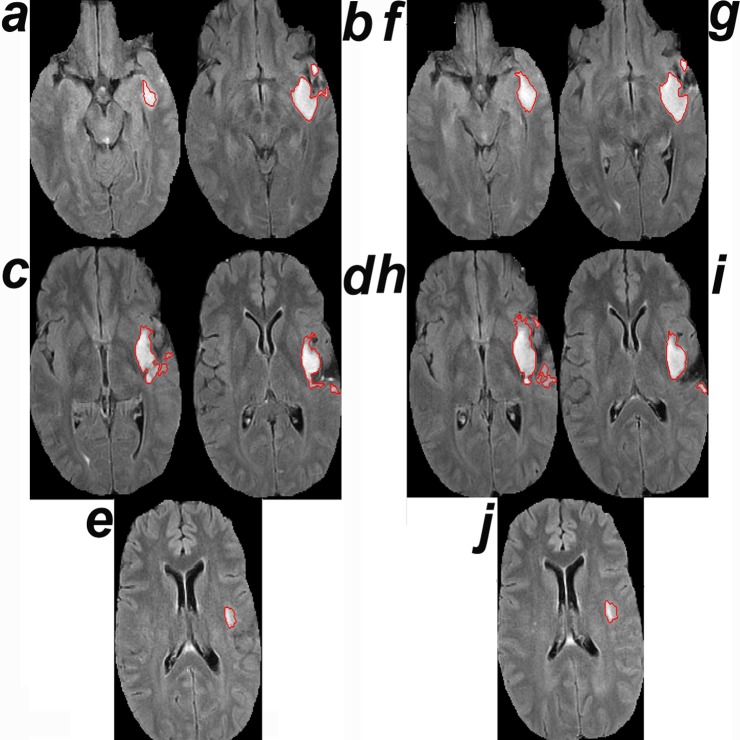
Fig 4. Growth away from the largest tumor section.
(a–e) MRI of tumor 4385 (see S1 and S2 Datas) at time 0. (f–j) MRI at the time point of growth detection by CAD. The surface areas of the tumor segments in (a–j) are 268, 1,174, 1,240, 962, 246, 718, 1,262, 1,764, 994, and 282 pixels2, respectively. The tumor exhibits larger percent growth from baseline in the third dimension (compare a and f: 268 and 718) away from the section containing the largest tumor component at baseline (compare c and h: 1,240 and 1,764). The second MRI was deemed stable by visual comparison.

