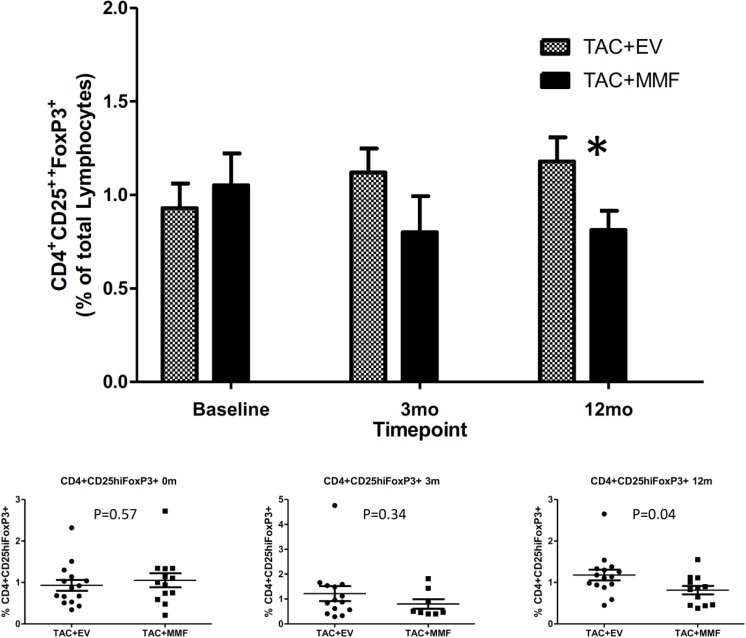
Fig 4. Percentage of CD4+CD25hiFOXP3+ regulatory T cells in the peripheral blood between study groups.
Flow cytometric analyses were performed as described in Materials and methods. The number of subjects analyzed at—Baseline: TAC+EVR N = 15,TAC+MMF N = 13; 3 mo: TAC+EVR N = 14,TAC+MMF N = 9; 12 mo: TAC+EVR N = 15,TAC+MMF N = 12. Please see Table C in S5 File for complete information.

