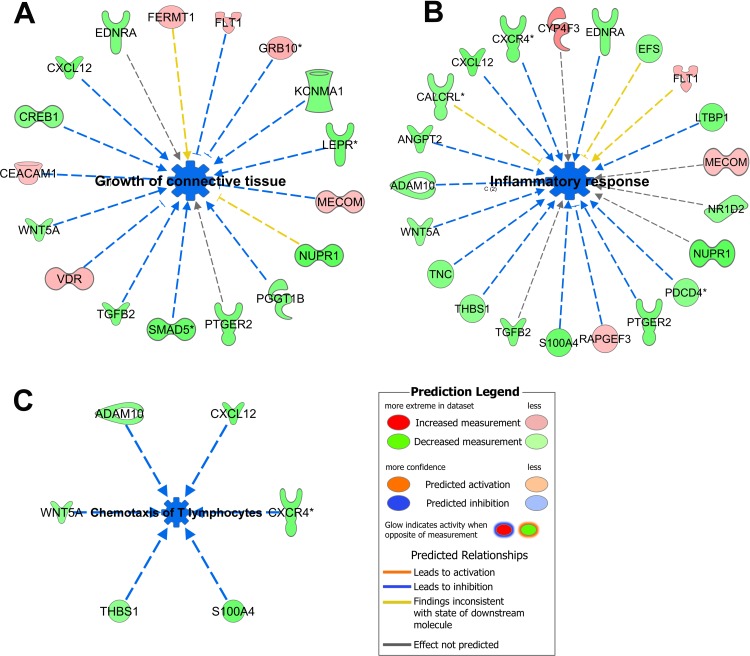
Fig 6. Inhibition of major functions.
Functions like growth of connective tissue (A), inflammatory response (B), and chemotaxis of T lymphocytes (C) were predicted to be inhibited (blue) and the genes involved were mostly downregulated (green). The legend with the color code for the prediction is shown at the bottom right. Please see Table G in S5 File for complete information.

