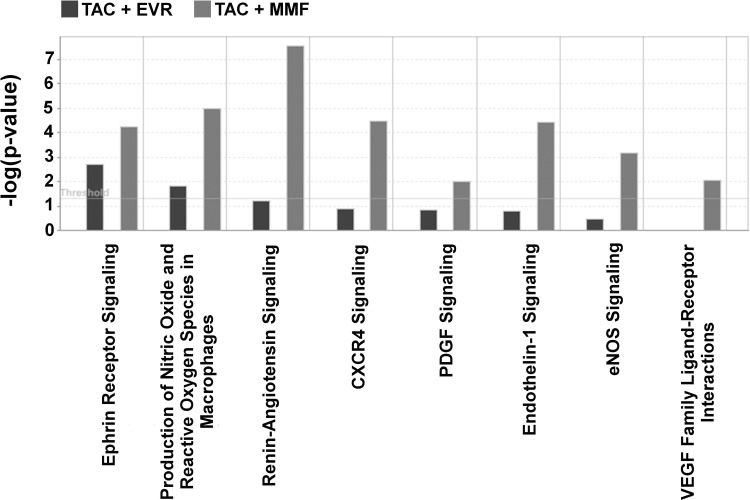
Fig 8. Analysis of time dependent changes in gene expression pathways in TAC+EVR and TAC+MMF groups.
Based on comparison analysis of differentially expressed genes at 12 month in comparison to 3 months post-transplantation on the two studied groups, it was observed that pathways related to cell proliferation, chemotaxis and inflammation were much pronounced in TAC+MMF (grey) in comparison to TAC+EVR (black). Please see Tables J and K in S5 File for complete information.

