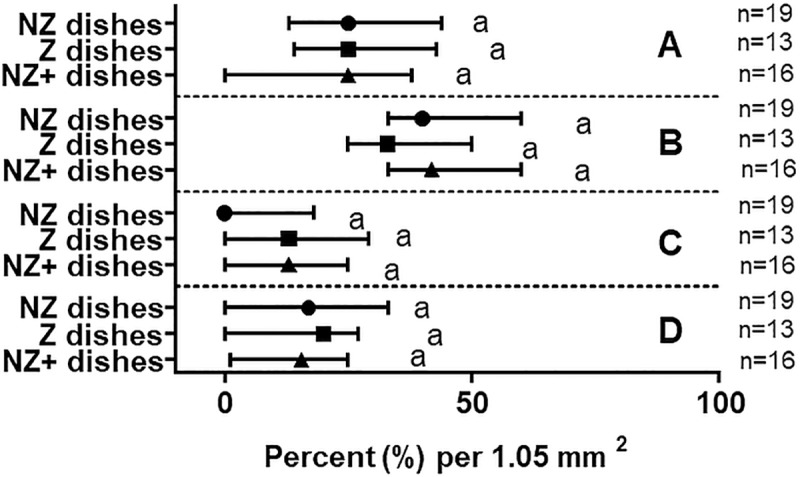
Fig 4. Shape classification and occurrence of 3-D endometrial cell structures.

Occurrence as a percentage per micrograph area of circular (A), elliptical (B), elongated (C), or irregular shapes (D) observed after two weeks of culture in different treatment groups (Median with IQR). Number of replicates for each treatment group are in parentheses. Matching lowercase letters indicate the absence of difference within each shape (P>0.05).
