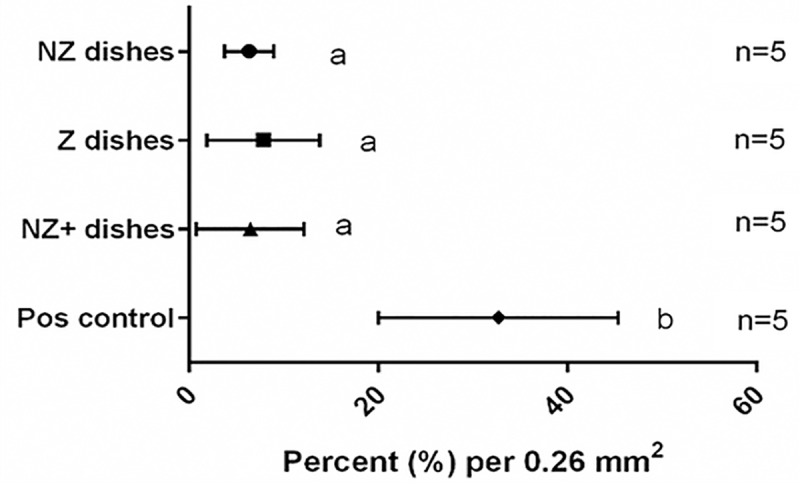
Fig 8. Early apoptosis assay results.

Percentage of early apoptotic cells after two week of culture in different treatment groups (Mean ± SD). Number of replicates for each treatment group are in parentheses. Matching lowercase letters indicate the absence of statistical difference between treatments (P>0.05). Positive control group showed significant difference (P = 5 × 10⁻¹³).
