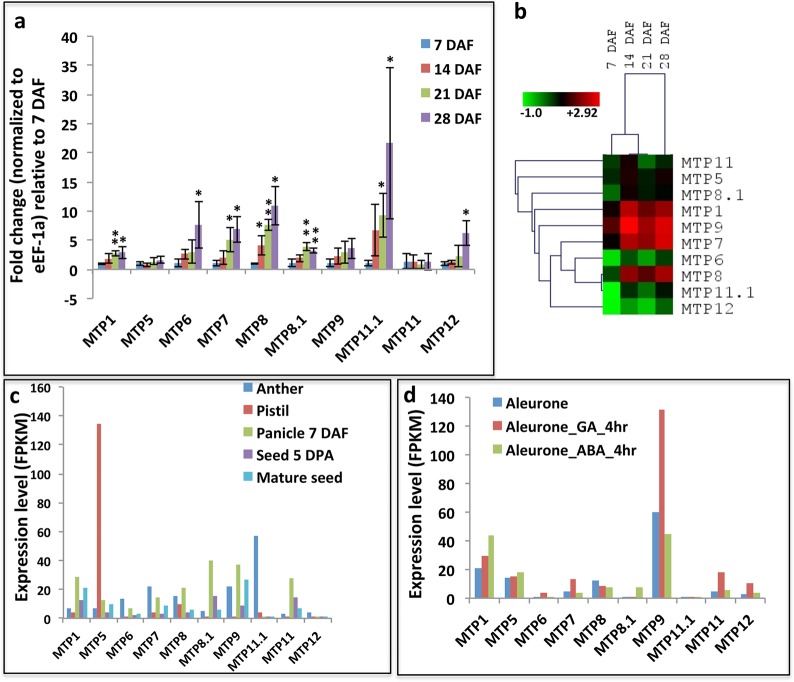
Fig 4. Expression profile of rice MTP genes during reproductive growth.
(a) Q-PCR analysis showing normalized expression of MTP genes in developing seeds at different DAF (Days After Fertilization) stages. Fold change between different time points is calculated against 7 DAF stage. Asterisks indicate T-test results where * = p<0.05, ** = p<0.01, *** = p<0.001. (b) Hierarchical clustering of Q-PCR results showing the expression profile of MTP genes in developing seeds. Relative fold change of MTP expression (normalized against OsUBQ5) was calculated against OseEF-1a expression (normalized against OsUBQ5) gene. The resuting fold change values were then used to make heatmap. The heatmap representing hierarchical clustering of log2 transformed expression values of MTP genes at different developmental stages (indicated at the top of each lane) was generated using MeV software package (http://mev.tm4.org/). The color bar below represents relative expression value from green color representing the lowest expression levels, black represents medium expression levels, and red signifies the highest expression level. (c, d) Expression values of rice MTP genes at various stages of reproductive growth shown as FPKM (fragments per kilobases of gene per million mapped reads) values obtained from Rice Expression Database (http://expression.ic4r.org/). (d) Expression in aleurone layer and effect of GA (Gibberellic Acid) and ABA (Abscisic Acid) on aleuronic expression.

