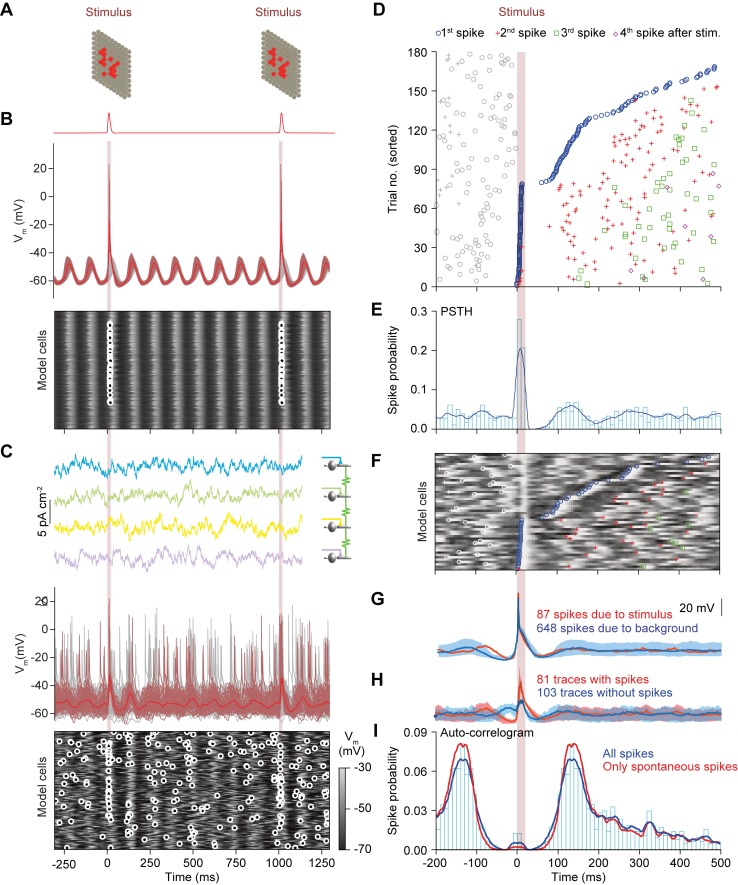
Fig 6. Synaptic input strongly affects the oscillatory behavior in a network model of the inferior olive.
(A) A phasic and synchronous input mimicking sensory input (see Fig 5A) was delivered to a subset of cells (indicated in red) of the model network. (B) Membrane potentials of all 200 cells in the network model in the absence of contextual input. Red trace (top) displays membrane potential average of cells receiving sensory input (see masks in A). Below are the membrane potentials of the model cells as a heat map. Each row exhibits the membrane potential of one model cell with the small circles indicating spikes. In the absence of contextual input, model neurons displayed long lived, synchronous and regular transient subthreshold oscillations. Note that the fact that the two stimuli fall in similar phases is coincidental. (C) Patterns of spiking responses changed dramatically in the presence of contextual input. Whereas in the absence of contextual input model neurons showed synchronous subthreshold oscillations and were silent except upon receiving sensory input, in the presence of contextual input the subthreshold oscillations are irregular and not strictly synchronous, while spikes occur throughout the simulation (~1 Hz average network firing). Note that despite the largely uncorrelated (90%) contextual input, model cells did not fire homogenously as in B, though loose clusters of synchronously firing cells did emerge. (D) Rhythmic responses to stimulation are reproduced by the inferior olivary network model. A representative cell of the model network with responses to sensory input reproduces rhythmic features of the PSTH and an auto-correlogram as found in vivo (see Fig 4). Raster plot of olivary spiking triggered by 182 stimuli, ordered by latency to the first spike following the stimulus. As seen in the in vivo data, the first spike after the stimulus can fall in one of multiple windows of opportunity. For this simulation, we included the contextual input. (E) Peri-stimulus time histogram showing the response peaks upon sensory input. (F) Raster plot like in C, but with overlaying membrane potentials. For clarity only the first 50 stimuli are displayed. Spike symbols follow conventions as in D. Trials with low latency were preceded by a dip in the preceding membrane potential, a phenomenon that can also be observed in D and H. (G) Average membrane potential of this neuron aligned by spikes that were either due to sensory input (87 spikes; red) or produced spontaneously (648 spikes; blue). The light shaded backgrounds represent the 10% and 90% percentile ranges of membrane potential. Dips in membrane potentials preceding the spikes reveal that for both groups a prior inhibition increased the probability of spiking. Importantly, except for a refractory period, we did not observe a clear oscillation pattern following either spike type, due to variability imposed by the contextual input. (H) shows the difference in spike triggered membrane potential averages for stimulus triggered and "spontaneous" spikes. (I) Auto-correlograms comparing rhythmicity of spikes produced during stimulation with spikes due to background (spontaneous) activity. Periodic stimuli delivered to the network reduced rhythmic responses at the peak. The extreme short-latency responses (in the center of the auto-correlogram) are due to the spikelets detected in the model traces that can also be seen in D.

