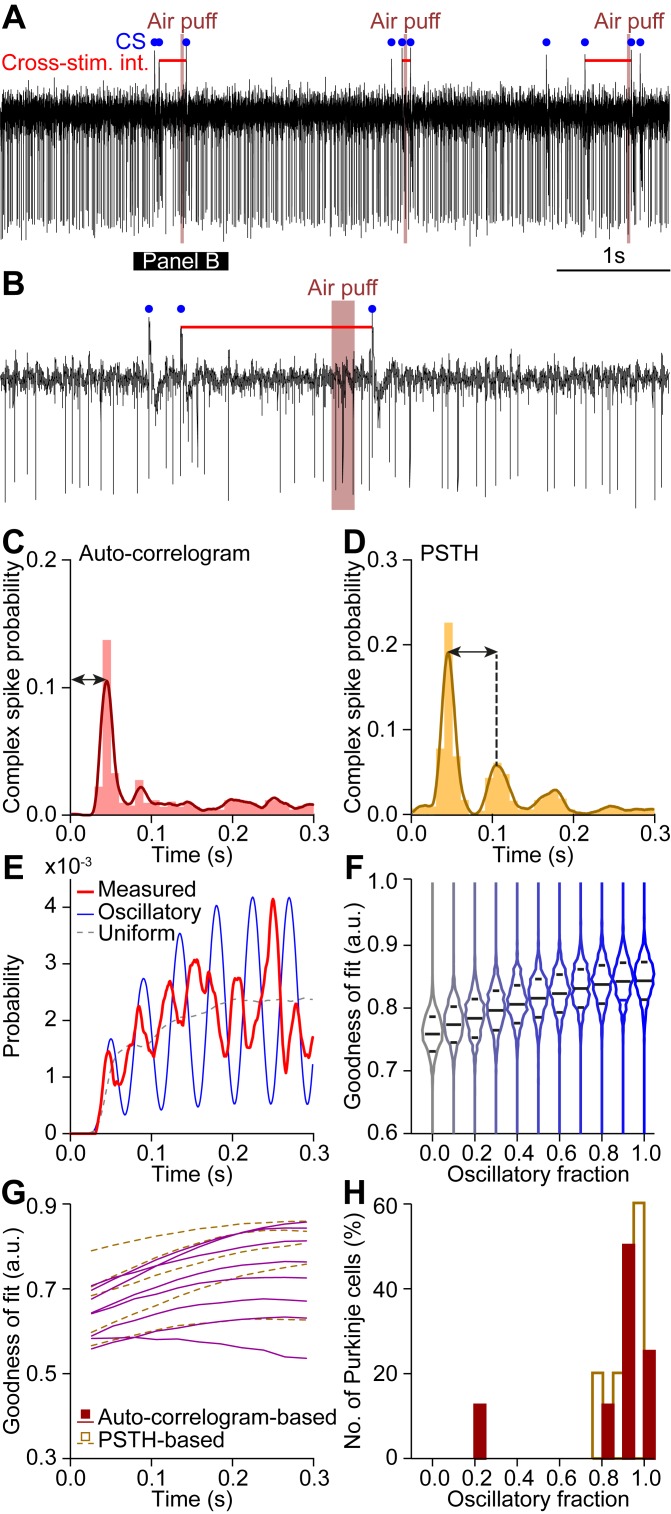
Fig 11. Complex spike responses to stimuli in most Purkinje cells are not conditioned on recent history.
We quantified the impact of presumed subthreshold oscillations on the occurrence and timing of complex spikes by assuming a preferred firing frequency for each individual Purkinje cell according to peri-stimulus time histogram and auto-correlograms. This approach is illustrated by a representative Purkinje cell (A-E). A representative trace is shown in A and enlarged in B, showing the cross-stimulus interval (horizontal red line). (C-D) For each Purkinje cell, the preferred frequency was derived from the auto-correlogram (C) and the peri-stimulus time histogram (PSTH; D; cf. Fig 2). (E) Intervals between the last complex spike before and the first complex spike after stimulus for each trial yielded a model of the preferred response windows (red line). The observed probability density function was compared with a probability density function based on a uniform complex spike distribution (dotted line), an oscillatory complex spike distribution (blue line), and 9 intermediate mixed models (see Methods). (F) The distributions of the goodness-of-fit for each of the 11 models showed a clear bias towards the uniform model, casting doubt on the impact of subthreshold oscillations on sensory-induced complex spike firing. The middle line indicates the average of all runs, while the upper and lower lines indicate 75 and 25% quartiles, respectively. (G) Distributions of the goodness-of-fit of all Purkinje cells that showed clear rhythmicity (see Methods). (H) Histograms of the best mix model shown in G indicate that the impact of the subthreshold oscillations on sensory complex spike responses is present, though small.

