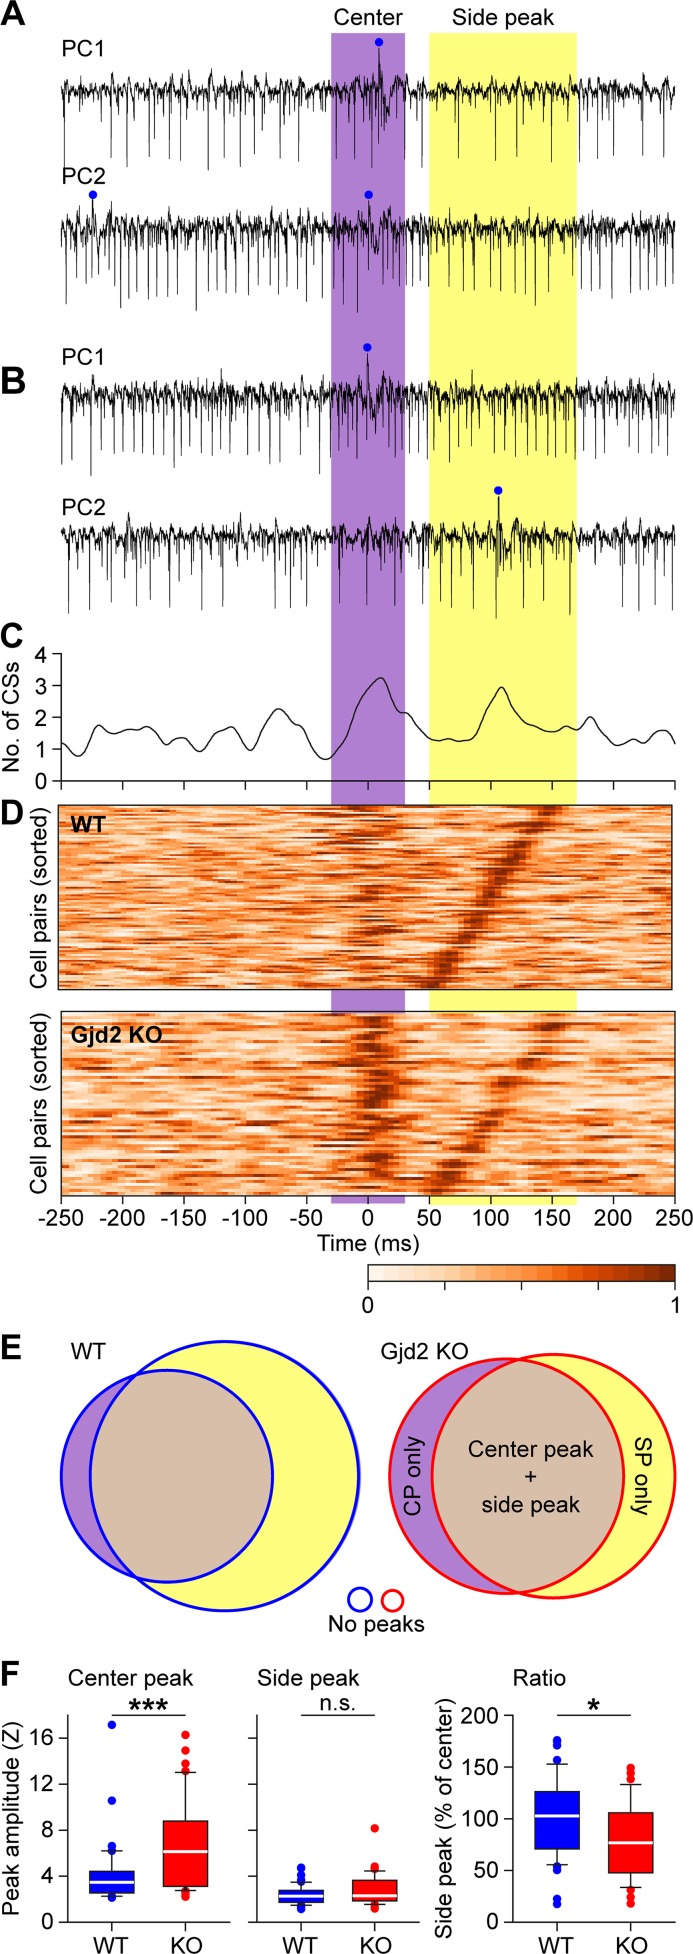
Fig 13. Coherence of complex spike firing of Purkinje cells over time.
(A) Two Purkinje cells recorded simultaneously in a wild type (WT) mouse during spontaneous activity, showing an epoch with near-synchronous complex spike firing with both spikes in the center-time interval. (B) Another epoch of the same cell pair, but now the second Purkinje cell fired a complex spike at the next cycle, leading to a double-peaked cross-correlogram for this cell pair, seen in C. (D) Heat map representations of cross-correlograms between simultaneously recorded Purkinje cells in WT and Gjd2 KO mice. Only pairs with a significant center or side peak are plotted. The cross-correlation of each pair is normalized to the bin with maximal correlation. The latency of the strongest side peak was used to order the cell pairs (including cells where center peaks were significant, but side peaks were not). Correlation direction was selected so that the strongest side peaks were always positioned on the right side. Note that while the center peak is stronger in Gjd2 KO, the side peak is more prominent in WT pairs. This side peak can be regarded as a “network echo”. (E) Venn diagrams showing the relative occurrence of center and side peaks in the presence and absence of gap junctions. (F) In the absence of gap junctions, the center peak, but not the side peak, was stronger (left and middle panel). Likewise, the normalized ratio of the side peak vs that of the center peak was lower in the Gjd2 KO mice (right panel). * and *** indicate p < 0.05 and p < 0.001, respectively (t test).

