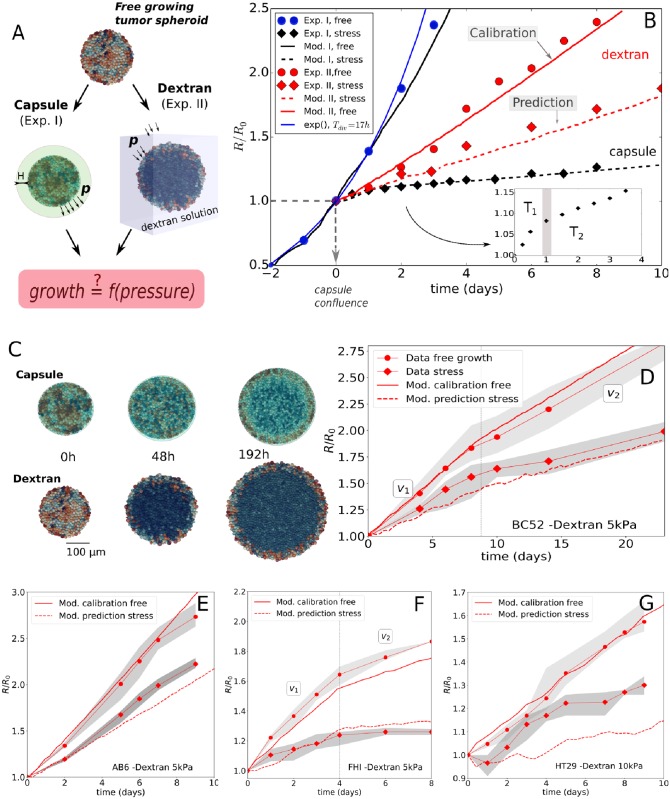
Fig 1. Summary of key experimental and simulation results.
(A)Two experiments setups for growing spheroids considered in this study. In experiment I, the spheroid is in mechanical contact with a capsule, and the mechanical resistance is determined by the wall thickness H. In experiment II, the spheroid is immersed in a dextran polymer solution, and the mechanical resistance originates from the osmotic pressure related to the dextran concentration. (B) Radial growth curves data of the spheroids in units of R0 (= 100 μm), for experiment I and II and respective model runs. The blue full circles are the free growth data for CT26, from [26]. The thin blue line indicates theoretical pure exponential growth with doubling time of 17h. The data starts deviating from an exponential after 2 days. The other lines are simulation results. The black dashed line indicates the optimal parameter set for the stress response in experiment I, performed with the final model I. The full black line indicates the same model run for free growth in Exp.I. After re-calibration of one model parameter in model I for the Exp.II conditions in absence of dextran (full red line), the model (referred to as model II to stress the change of the parameter) predicts the stress response in experiment II (red dashed line). (C) Simulation snapshots of both experiments. The cells are colored according to their volume (cells at the border are larger than in the interior). (D-G) Model simulations for Exp.II for the cell lines BC52, AB6, FHI and HT29, respectively. Full red lines represent the same initial calibration procedure, while red dashed lines represent the predicted stress conditions. The stress conditions are p = 5 kPa for AB6, FHI and BC52, and p = 10 kPa for HT29 (see Validation of model for experiment II: same cell lines as for experiment I).

