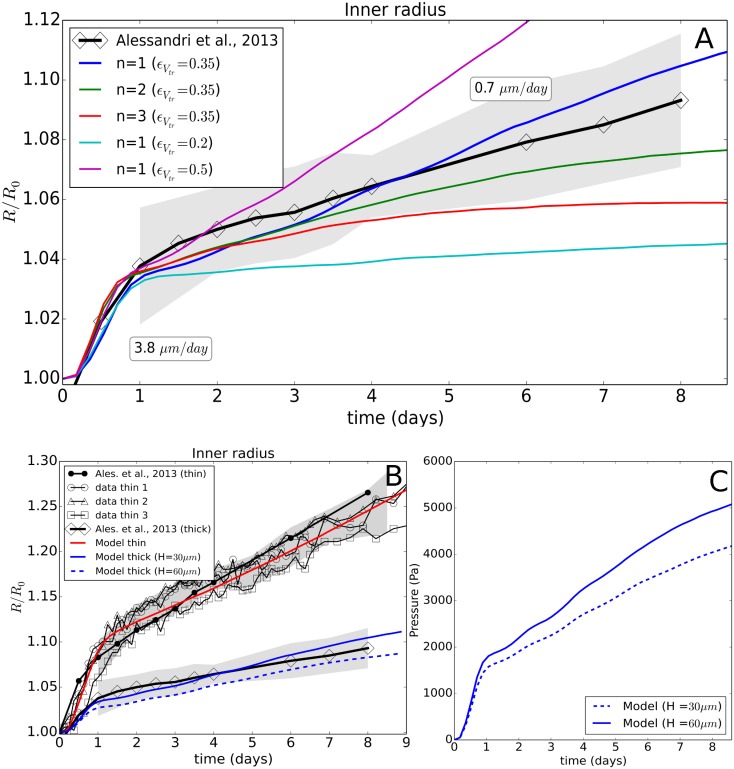
Fig 5.
(top) (A) Time evolution of the thick capsule radius (H = 30 μm), shown for the experimental data and the simulation with Model I, indicating the effect of the parameter n and . As the number of data sets on the thick capsule did not suffice to estimate the experimental error, the errors on the thick capsule data (gray zone) were estimated from the spreading on the thin capsule data, by determining the minimum—maximum intervals for the thin capsule data. These were then rescaled by the ratio of thin—thick capsule dilatations and shifted on to the thick capsule curve. (B) Global view of experiment I and II and respective model runs, including a model prediction for a capsule wall thickness H = 60 μm. (C) Simulated evolution of the average pressure in a capsule with H = 30 μm and H = 60 μm.

