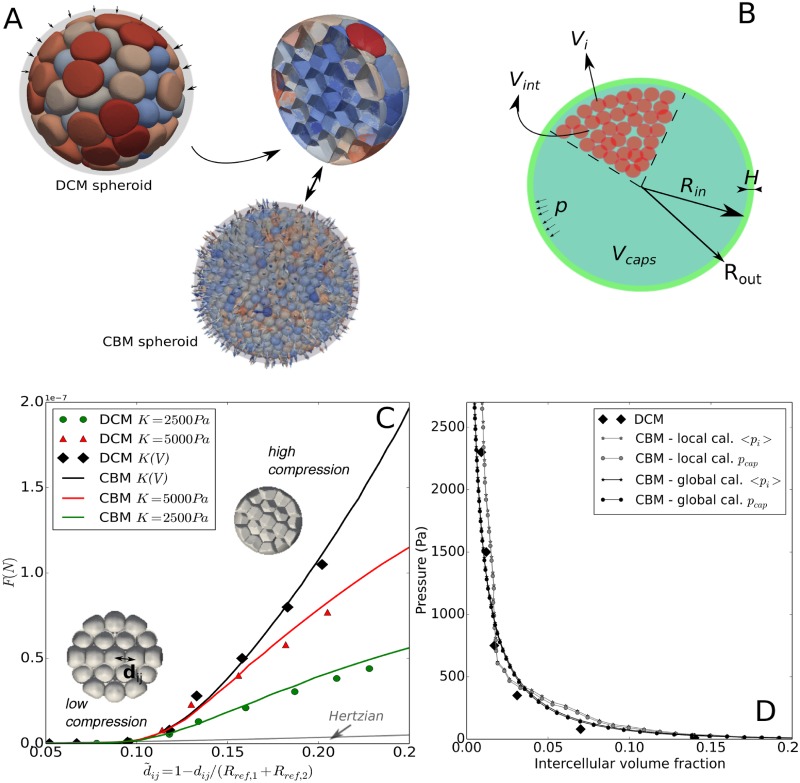
Fig 8.
(A) Cartoon illustrating the compression experiment using deformable cells in a capsule to calibrate the center-based model. (A, bottom) Equivalent compression experiment using the center-based model with indication of the maximal principal stress directions of the cells in the capsule during compression using Eq (11). (B) Cartoon showing the volume compartments Vi, Vint and Vcaps in a capsule with thickness H. (C) Average contact force vs. for different K values simulated using DCM (diamonds), and CBM with corrected Hertz contact force (full colored lines) replacing E by , see Eq 14. dij is the distance between the centers of cells i and j, Rref,k the radius of a free cell k ∈ {i, j}. The modified Hertz force shows the same evolution as the force in the DCM, while an uncorrected Hertz force (gray line, Eq 6) strongly underestimates the interaction force for strong volumetric compression. (D) Pressure curves during compression of the spheroid as a function of the inter-cellular volume fraction simulated with the DCM and the CBM with modified Hertz force using here K(V). The pressure for CBM was computed using both the capsule pressure and average virial stress per cell calculated from Eq (11). A representative movie (S3 Video) of these simulations is provided).

