Fig 3.

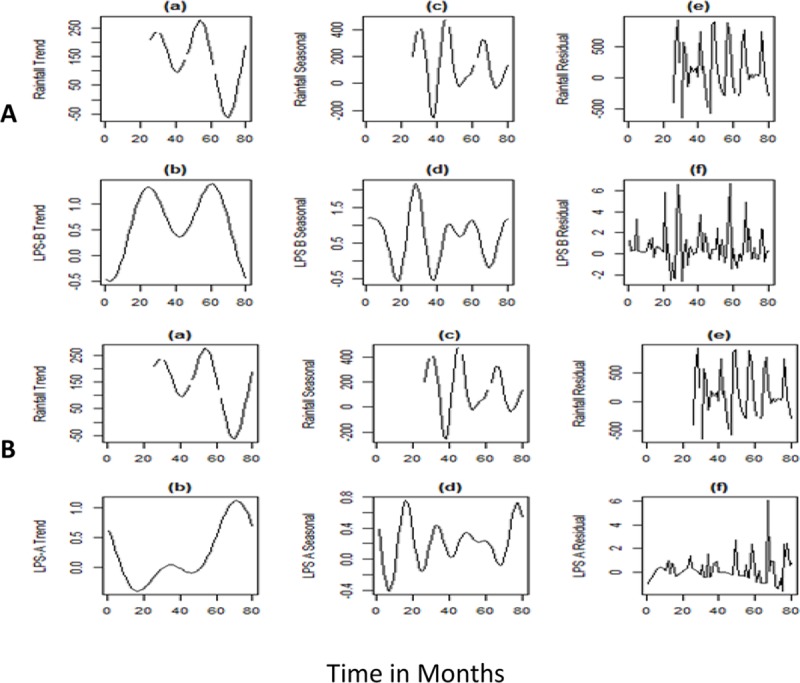
Fig A) shows reversal peaks for the trend and seasonal components of rainfall and LPS-A. B) shows an increase in LPS-B genotype with trend and seasonality. There is a lag period between the peak rainfall and the LPS-A and LPS-B genotypes.

Fig A) shows reversal peaks for the trend and seasonal components of rainfall and LPS-A. B) shows an increase in LPS-B genotype with trend and seasonality. There is a lag period between the peak rainfall and the LPS-A and LPS-B genotypes.