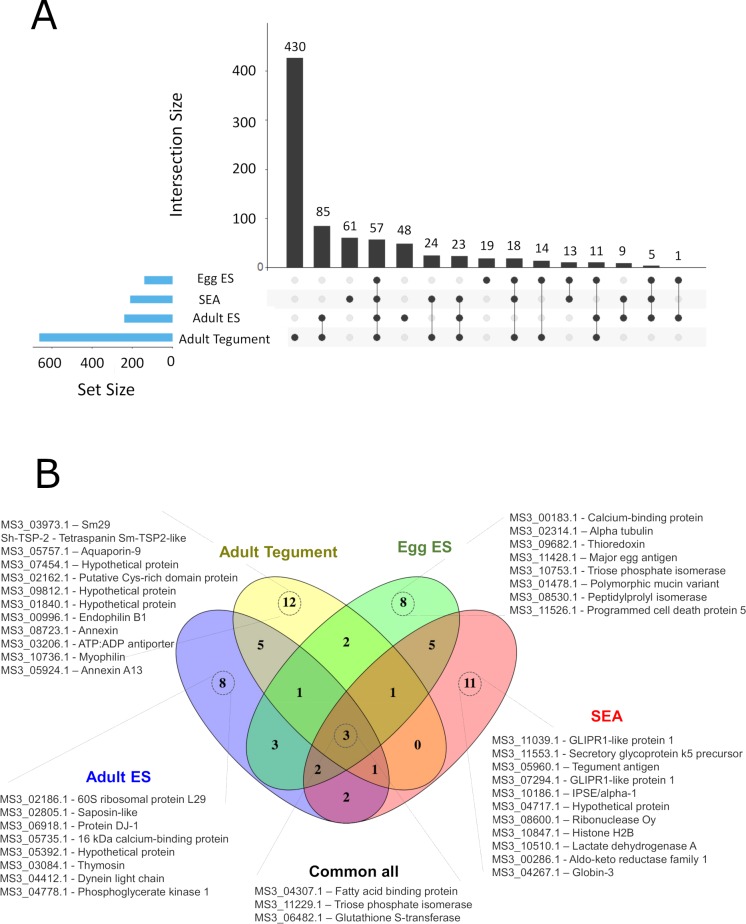
Fig 1. Proteins identified in the different Schistosoma haematobium proteomes.
(A) The numbers and intersections of the identified proteins from different Schistosoma haematobium proteomes was visualised using an Upset plot. Connected dots display shared proteins between datasets, and the total number of proteins identified in a particular dataset is indicated in the set size. (B) Venn diagram representing the intersection of the top 25 most abundant proteins from each dataset based on spectrum counting.

