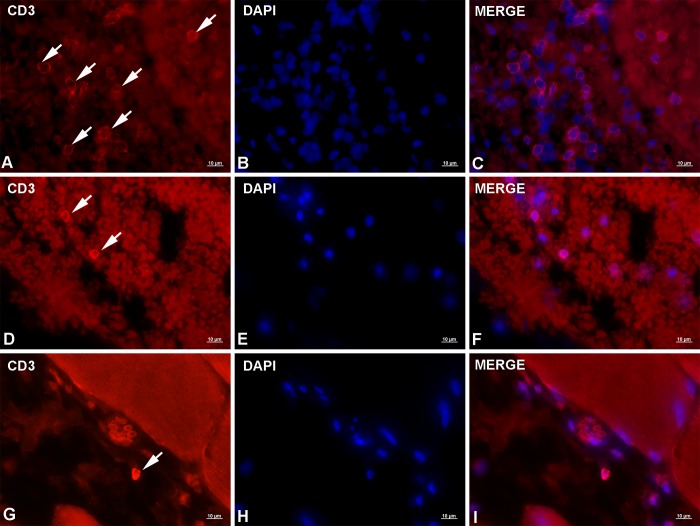
Fig 2. Representative micrographs of CD3 immunolabeling in rats experimentally infected with Anisakis spp. third-stage larvae.
(A) Moderate CD3 expression on a large number of T lymphocytes (arrows) in stomach adjacent to blood vessel; (B) DAPI-stained cell nuclei; (C) Merge of (A) + (B); (D) Two lymphocytes in the intestinal submucosa showing strong CD3 expression (arrows); (E) DAPI-stained cell nuclei; (F) Merge of (D) + (E); (G) Single T lymphocyte with very strong CD3 expression in perimysial connective tissue (arrow); (H) DAPI-stained nuclei; (I) Merge of (G) + (H). Immunofluorescence, scale bar = 10 μm.

