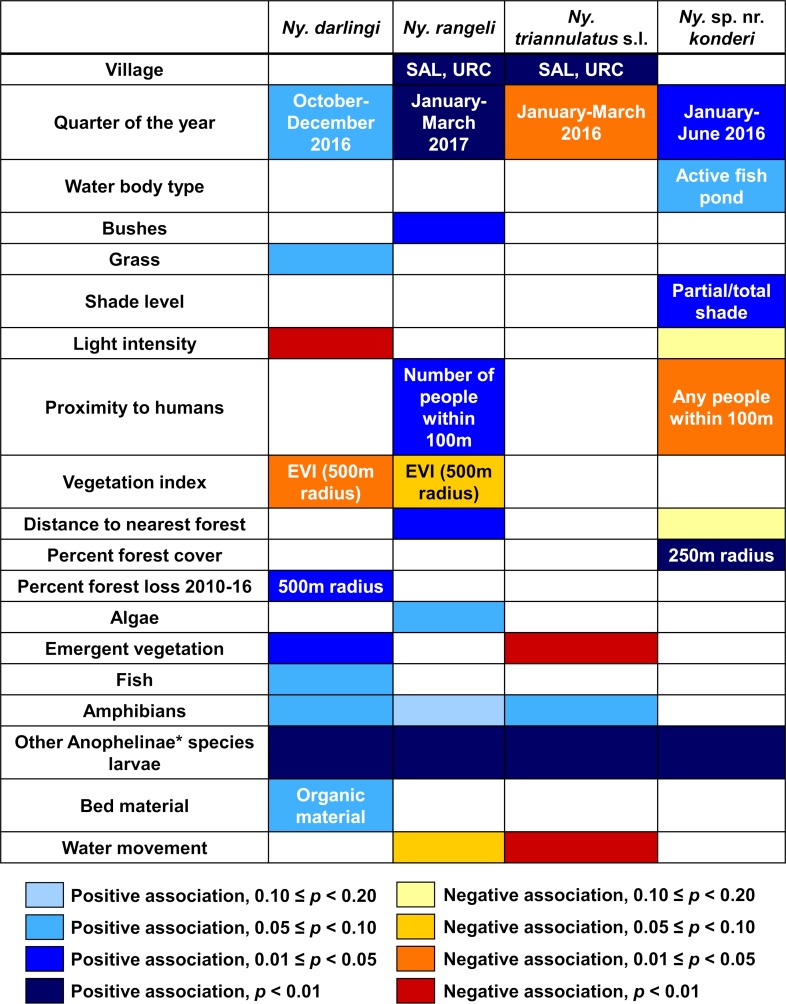
Fig 3. Heat map of results of multivariate logistic mixed-effects models for the presence of Ny. darlingi, Ny. rangeli, Ny. triannulatus s.l., and Ny. sp. nr. konderi larvae.
Four shades of blue coloring represent positive associations between the variable and the presence of each species, and yellow, orange, or red coloring each represent a negative association, with more intense colors representing lower p-values for the coefficient in the regression model. White coloring indicates that the variable was not included in the multivariate model for that species. *Includes any identified larvae in the genera Nyssorhynchus, Anopheles, or Stethomyia.

