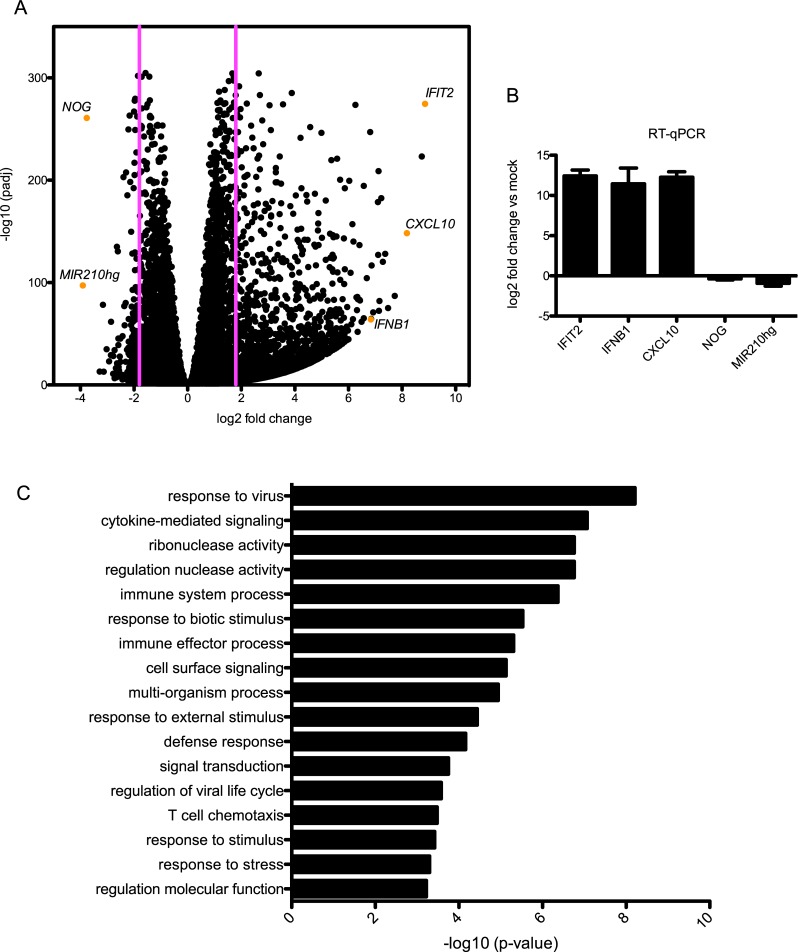
Fig 2. Differentially expressed genes and associated gene ontology terms at 48hpi.
A. Volcano plot of DEGs illustrating significance cut-off set to log2 fold change of 1.8. DEGs validated by RT-qPCR are labeled. B. RT-qPCR confirmation of expression level changes in DEG analysis. C. GO terms associated with upregulated genes.

