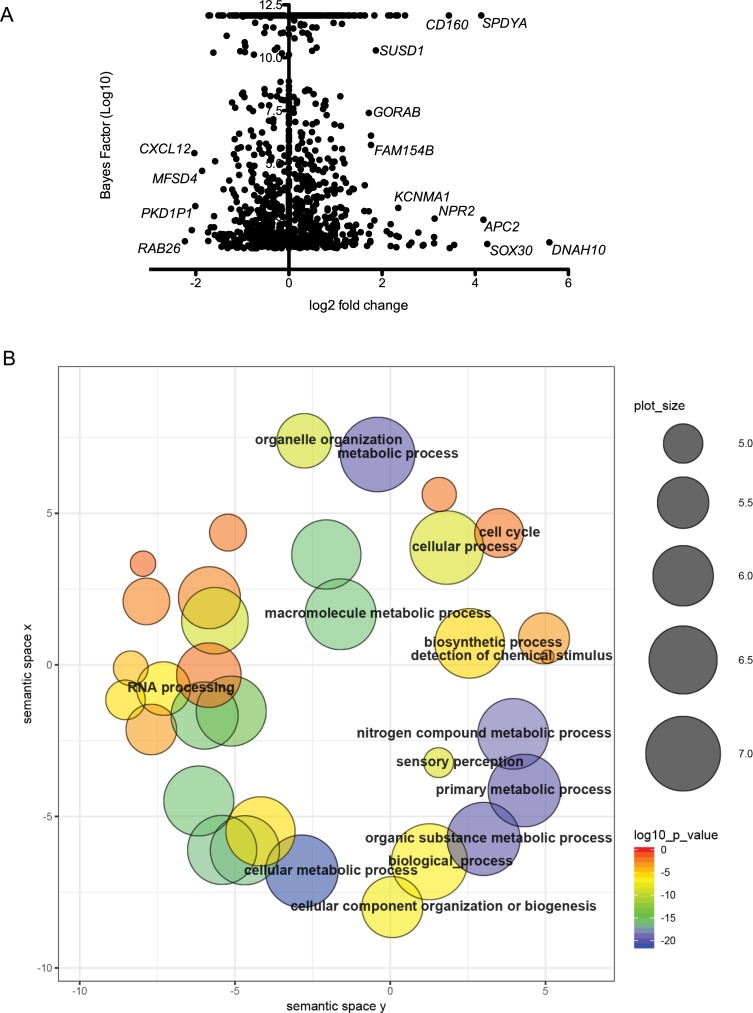
Fig 5. Expression and GO analysis of alternatively spliced transcripts.
A. Alternative splicing events plotted with Bayes factor represented on the y-axis and differential expression on the x-axis. B. REVIGO scatterplot analysis of overrepresented GO terms associated with AS genes. The two-dimensional plot clusters GO terms based on semantic similarities. Bubble color corresponds to the p-value; size indicates the frequency of the GO term within the database.

