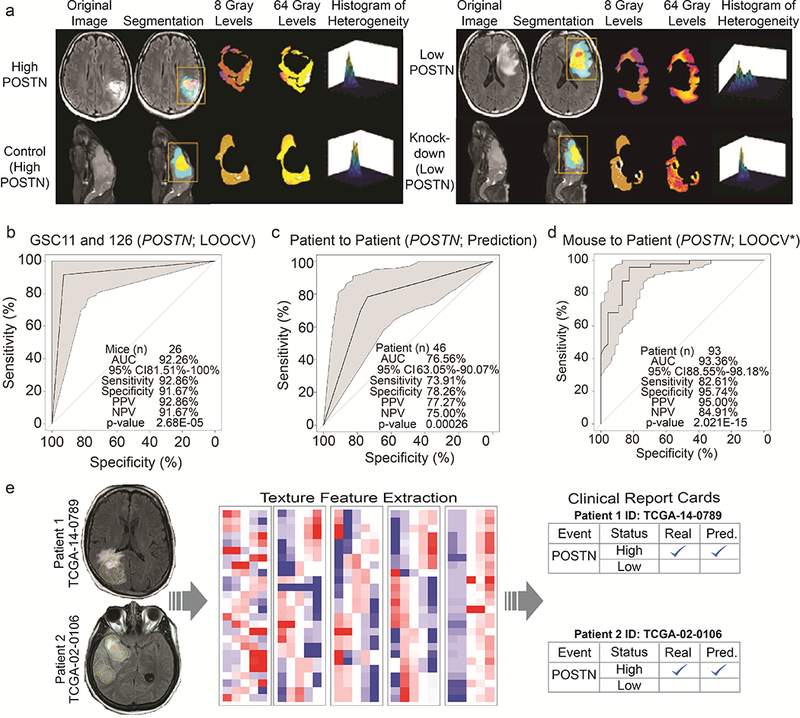
Figure 4: Radiomics based features are conserved and are predictive of POSTN levels across xenograft and human tumors.

(a) High POSTN tumors from patients and orthotopic xenograft mice (Control) (left) show greater similarity of textural heterogeneity at 8 Gray and 64 Gray levels and are distinct from that of low POSTN tumors from patients and orthotopic xenograft mice (KD) (right). (b) LOOCV ROC curve depict the performance of the GSC11 and GSC126 mouse-based predictive model using 17 radiomic features to predict control and KD mice across cell lines with 92.26% accuracy and p-value 2.68E-05. 95% CI, sensitivity, specificity, PPV, NPV of models are shown within each plot. (c) ROC curve depicts the performance of TCGA training set (N=46) based predictive model using 48 radiomic features to predict POSTN expression levels in validation set (N=47) with 76.65% accuracy. (d) The LOOCV* ROC curve shows the association of 17 radiomic features derived from GSC11 and GSC126 mice from panel (b) with 93 patients with endogenous high and low POSTN expression levels. (e) Radiome sequencing in clinics. Radiogenomic probability maps and radiome sequencing clinical report cards for two representative patients. Summary of the radiomics-based prediction of the genomic events/status of GBM for two representative patients. The left panels show the segmented patient brain MRIs delineating the tumor. The right panels show the radiome sequencing clinical report cards summarizing the status of POSTN expression. A check mark indicates that the prediction was correct.
