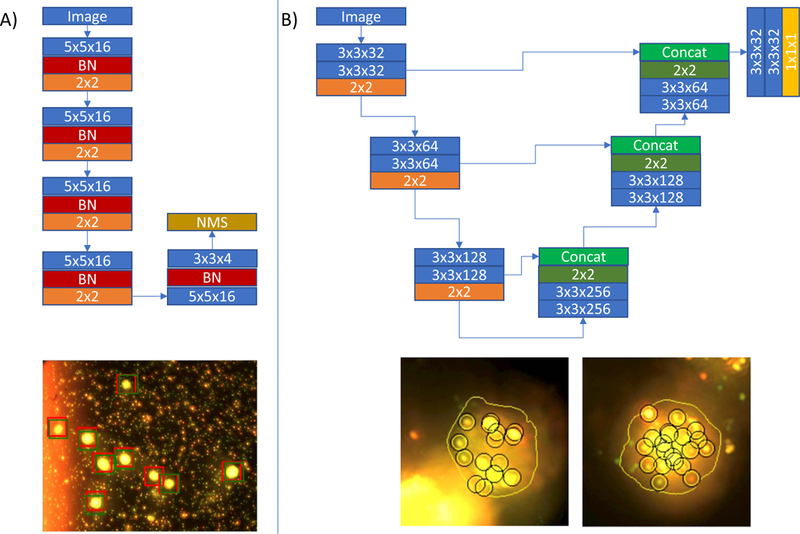
Figure 3.

Deep learning networks. A) Network used to find cells in a field of view and an example of its performance. Red boxes in the fov stand for the reference standard. Green boxes stand for the detected cells. Please note the variable background. B) network used to find the contour of cells and examples of the contour on processed cells (with detected bound PNPs). Please note how the method is robust to background artifacts. In the network images, blue boxes correspond to convolution operations, red boxes to batch normalization, orange to max-pooling, dark green to upsampling operations, concat stands for concatenate, NMS for non-maxima-suppression and the yellow box stands for a convolution with a sigmoid activation function. Each layer has its associated parameters on the box.
