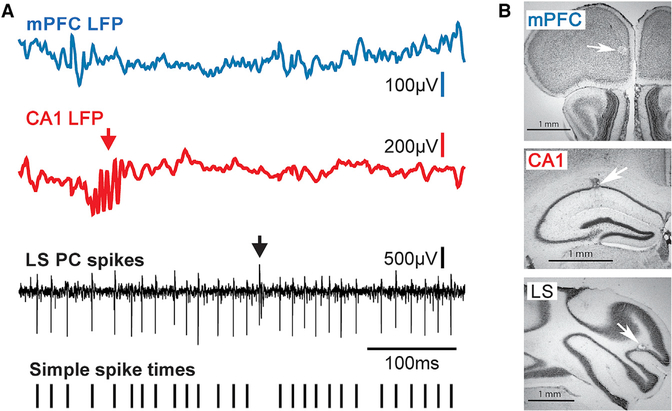
Figure 1. Raw LFP and Single-Unit Spike Signals and Anatomical Reconstructions of Recording Sites.
(A) Raw LFPs recorded in the mPFC (blue trace) and CA1 (red trace), and raw single-unit PC spike activity recorded in the cerebellar LS (black trace). The arrow in the LFP recording from the CA1 region points to a sharp wave ripple event, a brief high-frequency oscillation characteristic for the hippocampus. The presence of sharp wave ripples in the LFP recordings was used for online verification of electrode tip placement within CA1. The arrow in the trace of raw PC spike activity marks the occurrence of a complex spike, which reflects input from the inferior olive. Complex spikes are characteristic for PCs and were used for online identification of PC activity. The bottom trace shows tick marks representing the time sequence of simple spikes extracted from the raw trace and used for subsequent analysis.
(B) Photomicrographs of Nissl-stained sections of the mPFC, CA1, and cerebellar LS showing microlesions at recording sites (white arrows).
Scale bars in all three panels are 1 mm.

