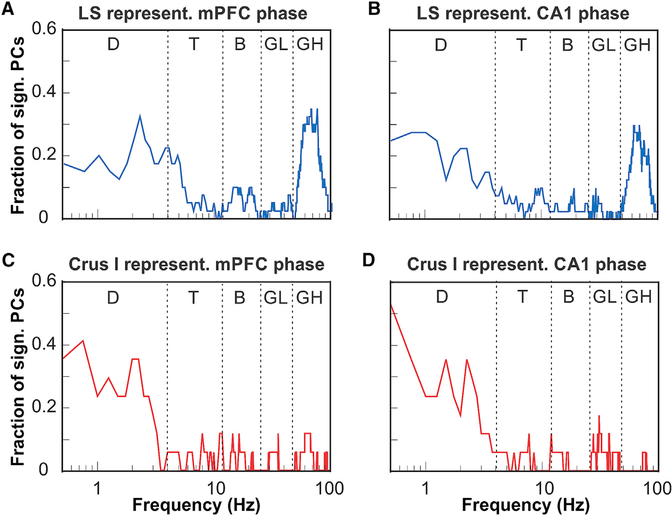
Figure 4. Representations of the Phase of Oscillatory LFP Activity in the mPFC and CA1 by Cerebellar PCs in Lobulus Simplex and Crus I.
(A) Fraction of PCs in LS (n = 32) whose simple spike activity was significantly modulated by the oscillatory phase plotted as a function of mPFC oscillation frequency (plotted on a log-10 scale). The function shows two peaks at the delta frequency range (0.5–4 Hz) and the high gamma range (50–100 Hz).
(B) As in (A) but showing fractions of LS PCs significantly modulated by the phase of oscillatory activity in CA1.
(C) Fraction of PCs in Crus I (n = 17) whose simple spike activity was significantly modulated by the oscillatory phase in mPFC plotted as a function of LS oscillation frequency. The function shows a single peak at the delta frequency range (0.5–4 Hz).
(D) As in (C) but showing fractions of Crus I PCs significantly modulated by the phase of oscillatory activity in CA1.
D, delta; T, theta; B, beta; LG, low gamma; HG, high gamma.

