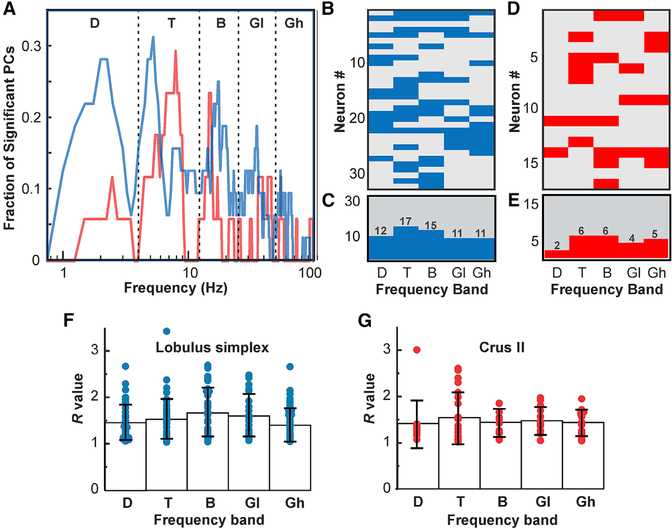
Figure 6. Summary of the Representation of mPFC-dCA1 Phase Differences in PC Spike Activity and Evaluation of Representation Strength for PCs in LS and Crus I Grouped by Frequency Band.
(A) Plot depicting the fraction of PCs with significantly modulated simple spike activity (p < 0.01) within each 0.25 Hz frequency step between 0.5 and 100 Hz in LS (blue graph, n = 32) and Crus I (red graph, n = 17). Modal peaks were observed within each of the conventional frequency bands: delta (D; 0.5–4 Hz), theta (T; 4–12 Hz), beta (B; 12–25 Hz), low gamma (GL; 25–45 Hz), and high gamma (GH; 45–100 Hz).
(B) Pseudocolor matrix with rows representing individual PCs and columns representing frequency bands. Blue fields indicate a significant correlation between PC simple spike activity in LS and mPFC-dCA1 phase differences in each frequency band (p < 0.01). Gray fields indicate no significant correlation.
(C) Histogram showing the number of PCs with significant spike-phase difference correlations within each frequency band.
(D and E) Pseudocolor matrix (D) and histogram (E) are as (B) and (C), respectively, but representing results from Crus I.
(F) Strength of mPFC-dCA1 phase difference representation by PCs in LS. R expresses resultant vector magnitude as the ratio of the vector length to the 95th percentile boundary, each relative to the median surrogate value. R values were grouped by frequency band. Each dot represents the resultant vector magnitude of a PC. Bars represent the mean R for each frequency band. Error bars represent SD.
(G) As in (F) but showing results for Crus I.

