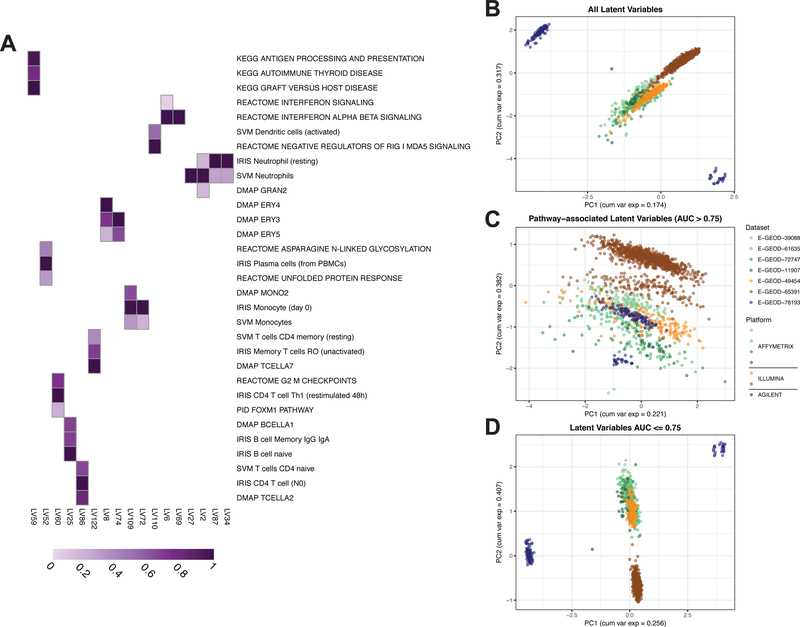
Figure 2. A PLIER model trained on a systemic lupus erythematosus (SLE) whole blood (WB) compendium learns SLE pathology-relevant latent variables and divides biological signal and technical noise.
(A) Selected latent variables (LVs) from the SLE WB PLIER U matrix. Purple fill in a cell indicates a non-zero value and a darker purple indicates a higher value. Only pathways with AUC > 0.75 in displayed latent variables are shown. Panels B-D display the first two PCs from different subsets of the latent space or B matrix. Points are samples. Samples are colored by dataset of origin and datasets from the same platform manufacturer are similar colors. (B) PC1 and PC2 from PCA on the entire B matrix illustrates a platform- or dataset-specific effect. (C) PC1 and PC2 from only pathway- or geneset-associated latent variables (LVs with AUC > 0.75 for at least one geneset) show a reduction in the technical variance evident in panel B. (D) PC1 and PC2 from only latent variables that do not have an association with an input geneset (all AUC <= 0.75) show a similar pattern to that of all latent variables. The dataset-specific effect in panels B and D is also observed in PCA on the gene-level gene expression data and at different AUC thresholds (Fig. S1).

