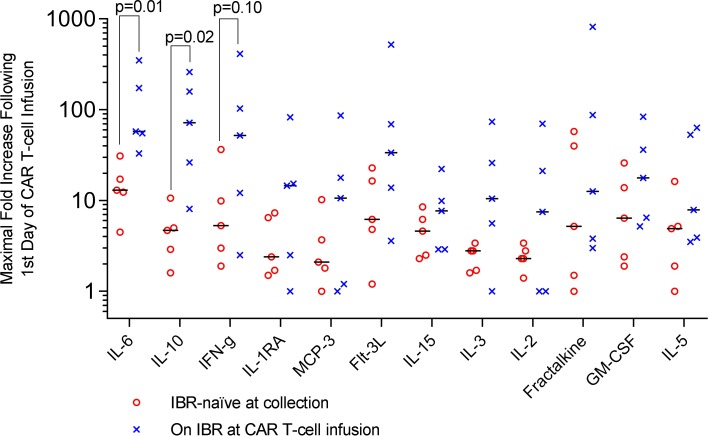
Figure 5. Peak levels of immunoregulatory cytokines following CAR T cell infusion.
Dot plots depicting fold increase in cytokine levels from prior to the first day of CAR T cell infusion to the peak within 1 month of infusion in 10 evaluable patients with CLL who received conditioning chemotherapy and CAR T cell infusion, stratified by whether ibrutinib naive (n = 5, open red circles) or on ibrutinib (IBR) at or immediately prior to CAR T cell infusion (n = 5, blue “X” marks). Median fold changes for each group are marked with black bars. Patients with ongoing or recent ibrutinib exposure at the time of CAR T cell infusion exhibited a significantly greater median fold increase in IL-6 and IL-10 (Wilcoxon-Mann-Whitney test). CLL, chronic lymphocytic leukemia. Note log scale.

