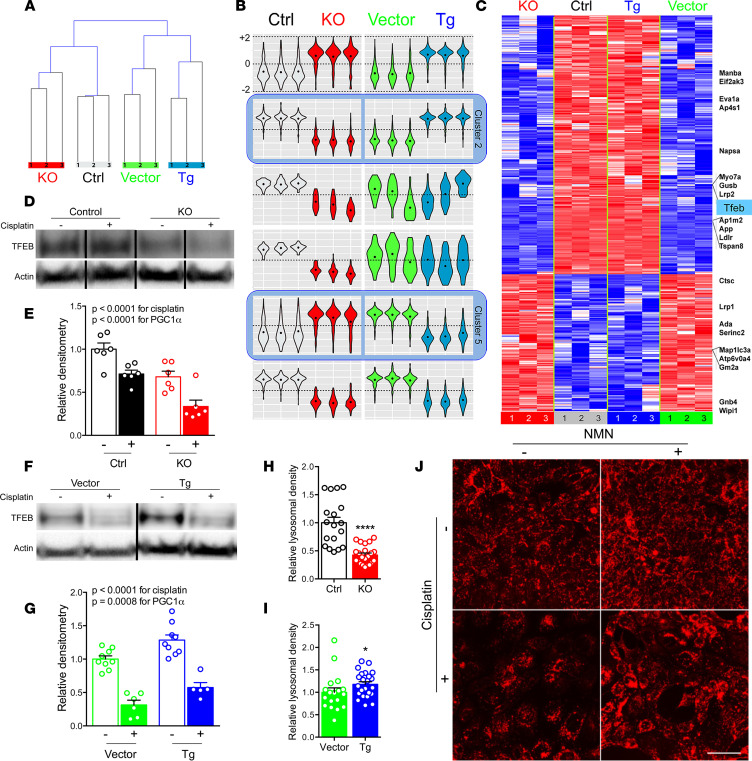
Figure 4. PGC1α promotes lysosomal biogenesis via TFEB.
(A) Hierarchical clustering of cisplatin-treated (10 μM, 24 hours) PGC1α-KO cells or Tg cells and respective controls. (B) Gene expression clusters identified by self-organizing maps analysis. (C) Heatmap of transcripts in clusters 2 and 5 (i.e., oppositely regulated PGC1α transcripts). (D–G) Representative Western analysis and densitometry of TFEB in cisplatin-treated (10 μM, 12 hours) PGC1α-KO cells vs. controls. n = 6/condition (D and E); analogous for PGC1α Tg cells (F and G), n = 5–9/condition. P values as indicated by 2-way ANOVA. (H and I) Lysosomal abundance quantified from LysoTracker-stained PGC1α-KO (n = 18 control vs. 22 KO) or Tg cells (n = 18 vector vs. 23 Tg). (J) Representative LysoTracker images (from n = 18–24/condition) following cisplatin (10 μM, 24 hours) ± concurrent NMN (1 mM). Scale bar: 20 μm. *P < 0.05, ****P < 0.0001 by Mann-Whitney U test.

