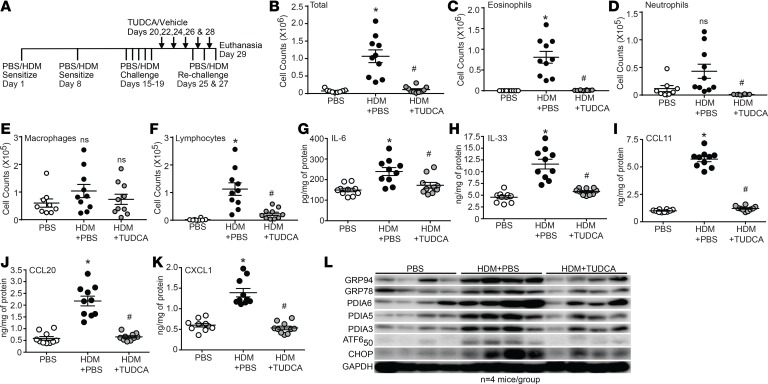
Figure 1. TUDCA attenuates allergic airway inflammation and the UPR.
(A) HDM and TUDCA challenge and treatment regimen. (B–F) Inflammation quantified from the BAL. n = 10 mice/group from 2 experiments (outliers removed in various groups; total cells PBS: n = 1; eosinophils PBS: n = 1; neutrophils PBS: n = 2; TUDCA: n = 2; macrophages PBS: n = 1; lymphocytes PBS: n = 2). (G–K) Quantification of cytokines/chemokines by ELISA from lung homogenates. n = 10 mice/group from 2 experiments. Kruskal-Wallis, 2-stage linear step-up procedure of Benjamini, Krieger, and Yekutieli. Two comparisons, both with the HDM group. *P < 0.05 vs. PBS group; #P < 0.05 vs. HDM group; ns, not significant. Error bars represent ± SEM. (L) Expression of ER stress markers by Western blot analysis of lung homogenates of HDM-sensitized and -challenged mice treated with TUDCA. n = 4 representative lung lysates for each group for the Western blots. Densitometry in Supplemental Figure 1. ns, not significant. Error bars represent ± SEM.

