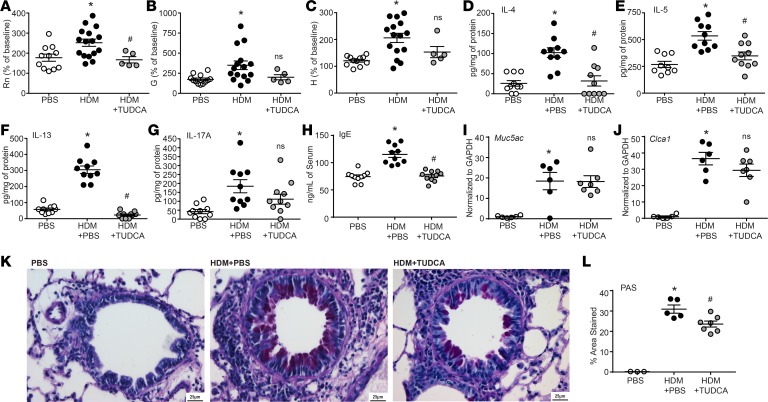
Figure 2. TUDCA attenuates AHR, IL-4, IL-5, IL-13, IgE production, and mucus metaplasia.
(A–C) AHR by FlexiVent in response to increasing concentrations of methacholine (PBS n = 11; HDM n = 16; and HDM plus TUDCA n = 7 mice from 2 experiments). One-way ANOVA, Tukey’s post hoc test. *P < 0.05 vs. PBS group; #P < 0.05 vs. HDM group (mice were removed in Rn, G, and H; in HDM plus TUDCA group n = 2 based on noncompliance with coefficient of determination [COD] value). (D–H) Quantification of cytokines by ELISA from lung homogenates and IgE from serum; n = 10 mice/group from 2 experiments (outliers removed in IL-5; PBS: n = 1). (I and J) Muc5ac and Clca1 expression in the lungs assessed by reverse transcription quantitative PCR (RT-qPCR); n = 7 mice from 2 experiments. (K) Representative images of PAS-stained lungs. Scale bar: 25 μm. (L) Quantification of PAS-stained lungs; n = 3–7 representative mice from 2 experiments. (D–H and J) Kruskal-Wallis, 2-stage linear step-up procedure of Benjamini, Krieger, and Yekutieli. Two comparisons, both with the HDM group. *P < 0.05 vs. PBS group; #P < 0.05 vs. HDM group. Rn, Newtonian resistance; G, tissue damping; H, tissue elastance; ns, not significant vs. HDM plus PBS group. Error bars represent ± SEM.

