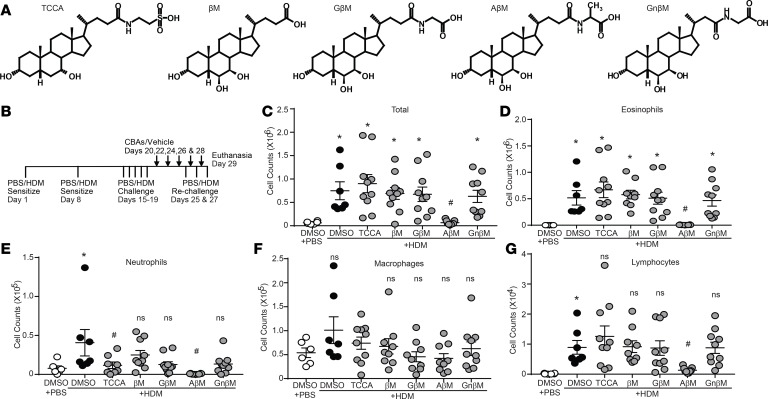
Figure 3. CBAs attenuate HDM-induced airway inflammation.
(A) Structures of the CBAs and UBA. (B) HDM and CBA treatment protocol. (C–G) Inflammatory cells quantified from the BAL, PBS, and HDM plus DMSO n = 6 mice/group from 2 experiments; HDM plus TCCA/βM/GM/AβM/GnβM n = 10 mice/group from 2 experiments (outliers removed in various groups; eosinophils PBS: n = 1; βM: n = 1; AM: n = 1. PMNs: TCCA: n = 2; AβM: n = 1. Macrophages: βM: n = 1; GβM: n = 1. Lymphocytes: βM: n = 1). *P < 0.05 vs. PBS plus DMSO group; #P < 0.05 vs. HDM plus DMSO group. ns, not significant. Error bars represent ± SEM.

