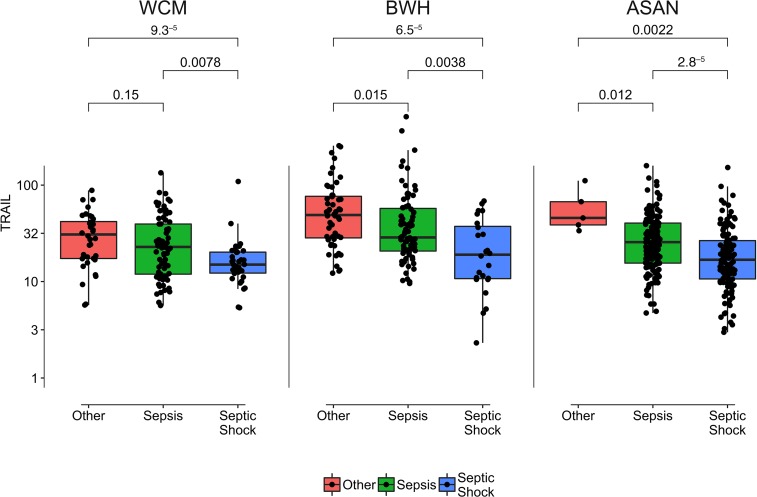
Figure 2. TRAIL levels of patients with nonsepsis critical illness, sepsis, and septic shock.
TRAIL levels are presented as median value (black line), interquartile range (box), and 95% (whiskers). P values are Kruskal-Wallis nonparametric comparisons with Bonferroni adjustment for multiple comparisons. Nonsepsis critical illness is shown in pink, sepsis is shown in green, and septic shock is shown in blue. WCM, Weill Cornell Medicine; BWH, Brigham and Women’s Hospital; ASAN, Asan Medical Center.

