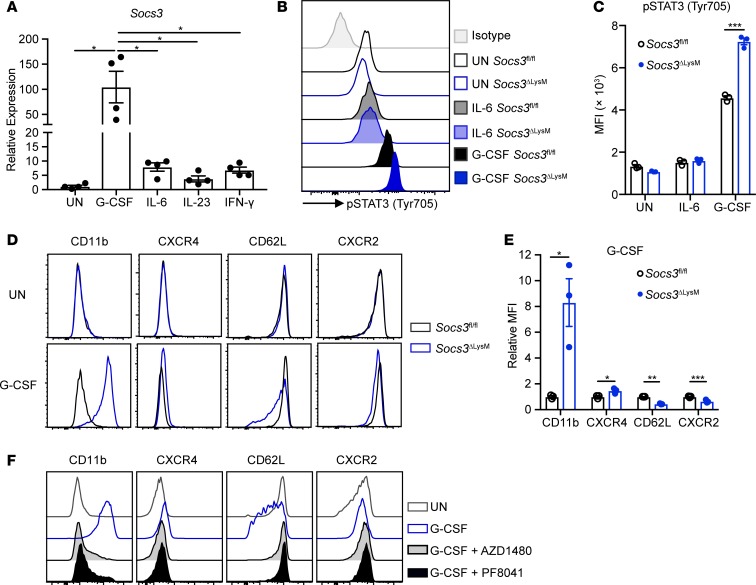
Figure 3. Socs3 deficiency promotes G-CSF hypersensitivity in neutrophils via JAK1 activation.
(A) Bone marrow neutrophils were isolated from C57BL/6 mice and stimulated with G-CSF (10 ng/ml), IL-6 (100 ng/ml), IL-23 (10 ng/ml), or IFN-γ (10 ng/ml) for 2 hours. Expression of Socs3 mRNA was analyzed by qRT-PCR (n = 4). (B–E) Bone marrow neutrophils were isolated from Socs3fl/fl or Socs3ΔLysM mice (n = 3). (B and C) Neutrophils were stimulated with G-CSF (10 ng/ml) or IL-6 (100 ng/ml) for 2 hours followed by intracellular staining for phosphorylated STAT3 (p-STAT3) (Y705). (D and E) Neutrophils were stimulated with G-CSF (10 ng/ml) for 8 hours, and expression of surface markers was analyzed. (F) Bone marrow neutrophils isolated from Socs3ΔLysM mice were pretreated with AZD1480 (25 μM) or PF8041 (25 μM) for 2 hours and then stimulated with G-CSF (10 ng/ml) for 8 hours, followed by surface staining. Plots are representative of 3 independent experiments. All flow cytometry plots (B–F) were gated on live, single CD45+CD11b+Ly6G+ neutrophils. All error bars represent ± SEM. *P < 0.05, **P < 0.01, and ***P < 0.001 by 1-way ANOVA (A) or 2-tailed Student’s t test (C and E). MFI, mean fluorescence intensity.

