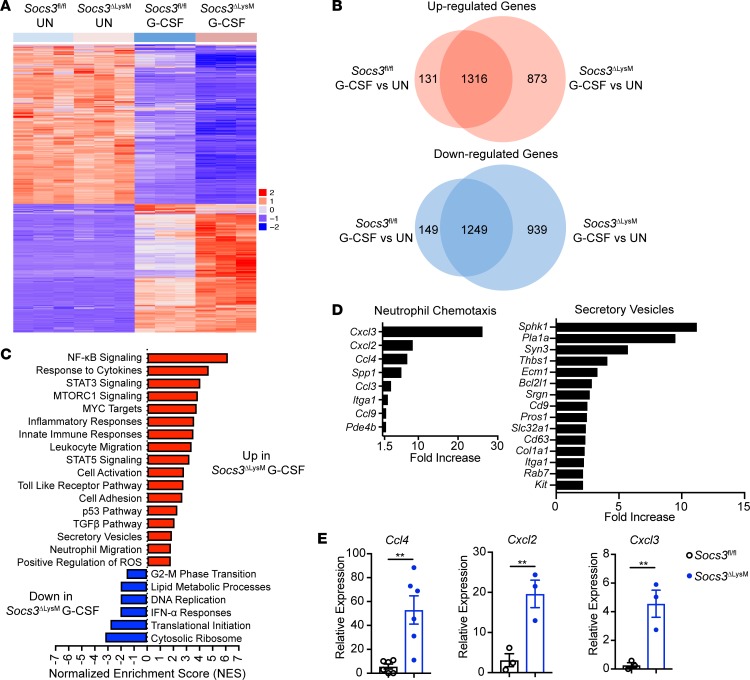
Figure 4. G-CSF induces a unique gene expression profile in Socs3-deficient neutrophils.
Bone marrow neutrophils isolated from Socs3fl/fl and Socs3ΔLysM mice were stimulated with G-CSF (10 ng/ml) for 8 hours, followed by mRNA extraction and RNA-Seq (n = 3). (A) Heatmap of differentially expressed genes (DEGs) among the 4 groups. (B) Venn diagram depicting DEGs between Socs3fl/fl and Socs3-deficient neutrophils in response to G-CSF. (C) DEGs between Socs3-deficient neutrophils and Socs3fl/fl neutrophils upon G-CSF treatment were ranked based on the adjusted P value and log2 fold change. GSEA illustrating upregulated and downregulated pathways in Socs3-deficient neutrophils in response to G-CSF. (D) Upregulated genes from selected pathways. (E) Bone marrow neutrophils isolated from Socs3fl/fl and Socs3ΔLysM mice were stimulated with G-CSF (10 ng/ml) for 8 hours, followed by mRNA extraction and qRT-PCR assay to determine mRNA expression of the indicated chemokines (n = 3–6). All error bars represent ± SEM. **P < 0.01 by 2-tailed Student’s t test.

