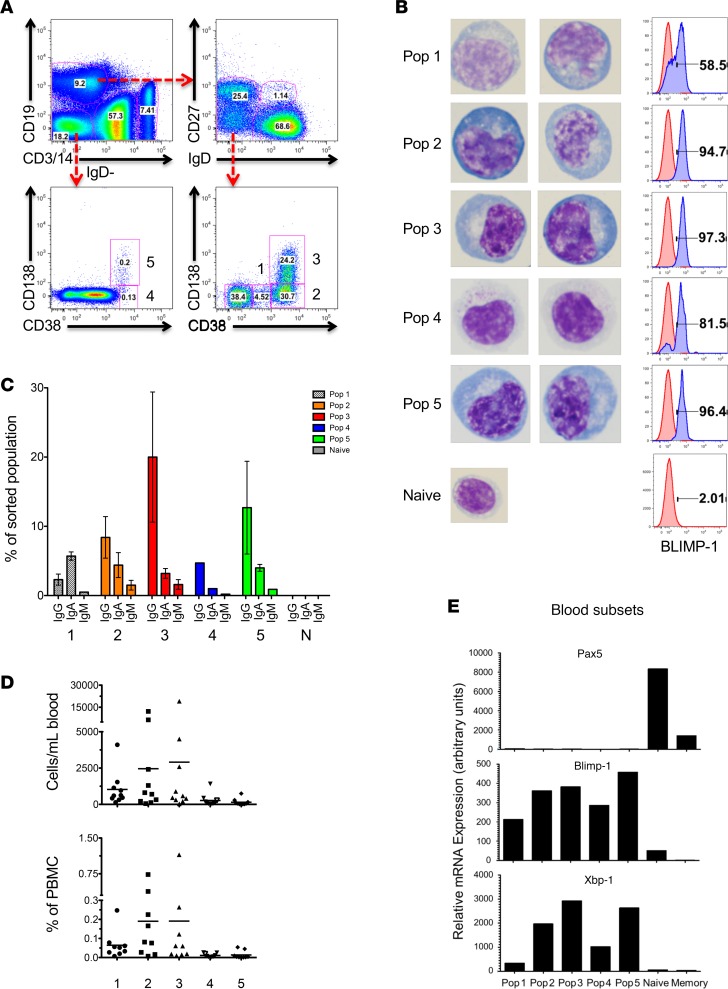
Figure 1. ASC subsets in human blood 7 days after tetanus vaccination.
(A) Top panels divide the CD19+ and CD19– fractions. Lower panels represent subsets of CD19–IgD– (left) and CD19+IgD– (right) fractions. (B) Morphology of blood ASC subsets (×100 magnification) by Wright-Giemsa stain. Left column: Sorted blood ASC subsets on day 7 after tetanus vaccination. ASC populations (pops) 1 to 5 and naive B cells are shown. Right column: Percentage of intracellular BLIMP-1 staining per subset is shown in blue histograms (naive controls in red). (C) Percentage of each ASC subset and naive B cells (N) expressing IgG, IgA, or IgM isotypes after peak vaccination. (D) Quantification of each blood ASC subset (pops 1 to 5) in cells/ml (top) and percentage of PBMCs (bottom). (E) Quantitative RNA expression of 5,000 sorted ASC subsets and naive and memory B cells for Pax5 (top), BLIMP-1 (middle), and Xbp-1 (lower), normalized to GAPDH in blood. Relative mRNA expression is expressed in arbitrary units.

