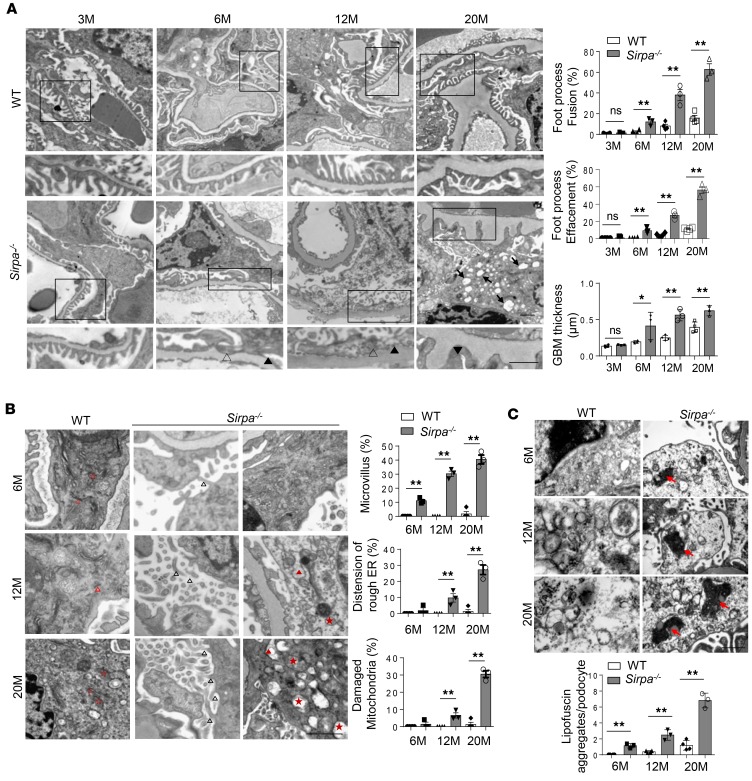
Figure 2. Detailed transmission electron microscopy analysis of glomeruli in SIRPα–deficient mice.
(A) Transmission electron microscopy (TEM) of foot process fusion and effacement of podocytes and the glomerular basement membrane (GBM) (podocytes of n = 4 WT mice and n = 3 Sirpa–/– mice were analyzed). Open arrowheads, foot process fusion; filled arrowheads, foot process effacement; filled arrows, vacuoles. Histograms represent quantification of foot process fusion, effacement of podocytes, and GBM thickness. (B) TEM of the glomerulus of 6-, 12-, and 20-month-old WT and Sirpa–/– mice. Open black arrowheads, microvillus; open red arrowheads, regular rough ER; filled red arrowheads, distension of rough ER; open red stars, regular mitochondria; filled red stars, damaged mitochondria. Histograms represent quantification of microvillus formation, distension of rough ER, and damaged mitochondria in WT versus Sirpa–/– mice. (podocytes of n = 4 WT mice and n = 3 Sirpa–/– mice were analyzed). (C) Lipofuscin accumulation in 6-, 12-, and 20-month-old Sirpa–/– mice (podocytes of n = 4 WT mice and n = 3 Sirpa–/– mice were analyzed). Arrows indicate lipofuscin aggregates. The histogram represents statistical analysis of lipofuscin aggregates. Scale bars: 1 μm. Data represent the mean ± SEM, and P value was analyzed by 2-tailed Student’s t test. *P < 0.05, **P < 0.01.

