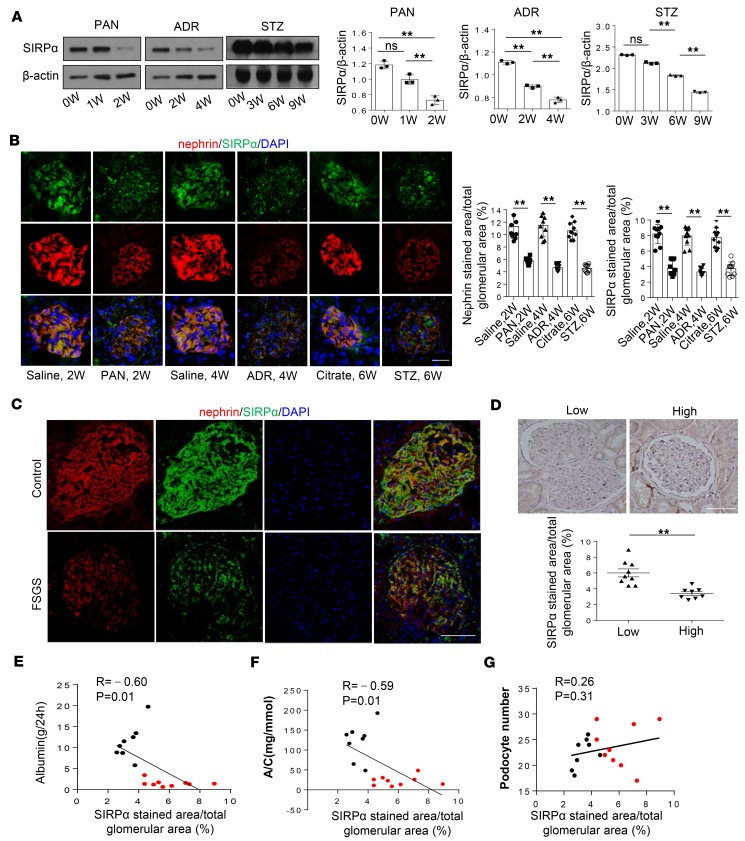
Figure 4. Decrease of SIRPα in podocytes of mice and humans under nephropathy.
(A) SIRPα level in glomerulus of mice with PAN, ADR, and STZ treatment over time. Immunoblots are representative of 3 independently performed experiments. Histograms show quantification of SIRPα level. (B) Immunofluorescence staining of SIRPα and nephrin in glomerulus of mice treated with PAN, ADR, and STZ for 2, 4, and 6 weeks (W) respectively. Quantification of SIRPα and nephrin levels in glomerulus was performed by counting approximately 10 glomeruli from 3 independent determinations. Data in A and B represent mean ± SEM from 3 independent experiments, and P value was analyzed by ANOVA with Tukey-Kramer test and 2-tailed Student’s t test, respectively. (C) Colocalization and expression level of SIRPα and nephrin in podocytes of healthy control and FSGS patients. (D) Glomerular immunohistochemistry staining of SIRPα in FSGS patients with low proteinuria (n = 9) and with high proteinuria (n = 8). Histogram represents quantification of glomerular SIRPα staining in the 2 groups of patients. Data represent mean ± SEM, and P value was analyzed by 2-tailed Student’s t test. (E, F, and G) Correlation analysis between SIRPα and albumin level, albumin/creatinine ratio (A/C), and podocyte number; r and P values were analyzed by Pearson’s correlation analysis; red and black plots represent FSGS patients with low and high proteinuria, respectively. In Scale bars in B, C, and D: 25 μm.**P < 0.01.

