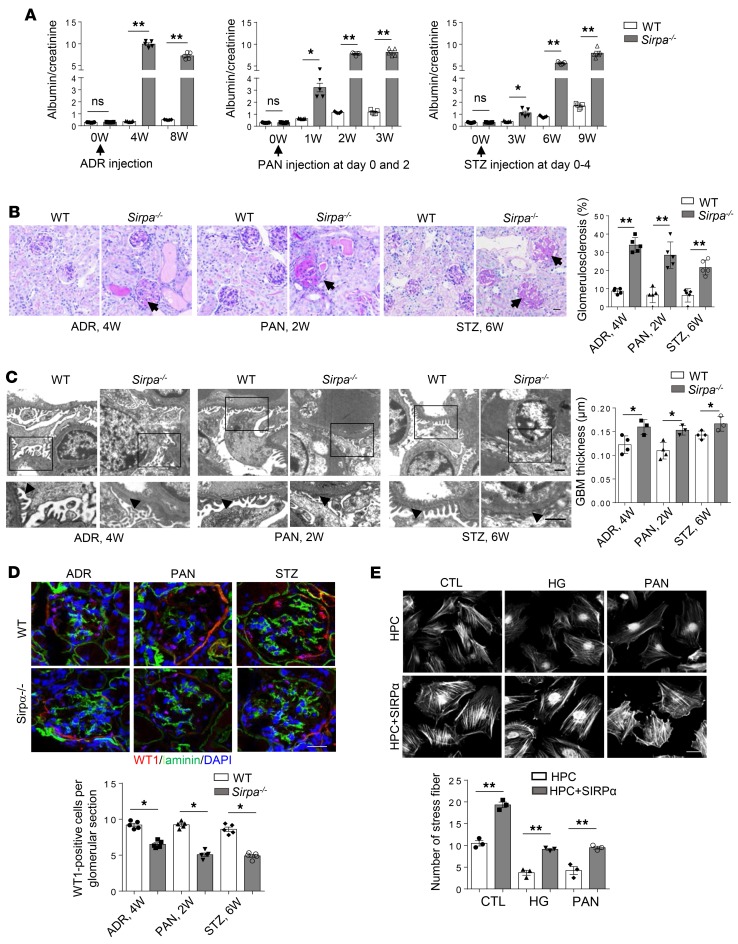
Figure 5. Sirpa–/– mice develop more rapid and severe renal injury in various models of nephropathy.
(A) Albumin/creatinine ratio (mg/mg) in WT and Sirpa–/– mice with ADR, PAN, and STZ treatment (n = 5 WT and n = 5 Sirpa–/– mice). (B) ADR, PAN, and STZ injection in Sirpa–/– mice resulted in glomerulosclerosis by PAS staining (arrows); scale bar: 50 μm. Histogram represents quantification of glomerulosclerosis (5 WT and Sirpa–/– mice of each group; 10–20 glomeruli of each mouse were analyzed). (C) ADR, PAN, and STZ injection in Sirpa–/– mice results in more severe foot process fusion by electron microscopy (arrows indicate fused foot processes); scale bars: 1 μm. Histogram represents quantification of GBM thickness (glomeruli from 4 WT and 3 Sirpa–/– mice were analyzed). (D) ADR, PAN, and STZ injection in Sirpa–/– mice results in severe loss of podocytes (n = 5 WT and n = 5 Sirpa–/– mice; 5–6 glomeruli for each mouse were analyzed). Scale bar: 25 μm. (E) Fluorescence staining of F-actin using phalloidin in human podocytes (HPC) transfected with SIRPα-expressing plasmid. Scale bar: 25 μm. Quantification of fiber formation was performed by counting approximately 60 podocytes from 3 independent determinations. Data in A–E represent mean ± SEM, and P value was analyzed by 2-tailed Student’s t test. *P < 0.05, **P < 0.01.

