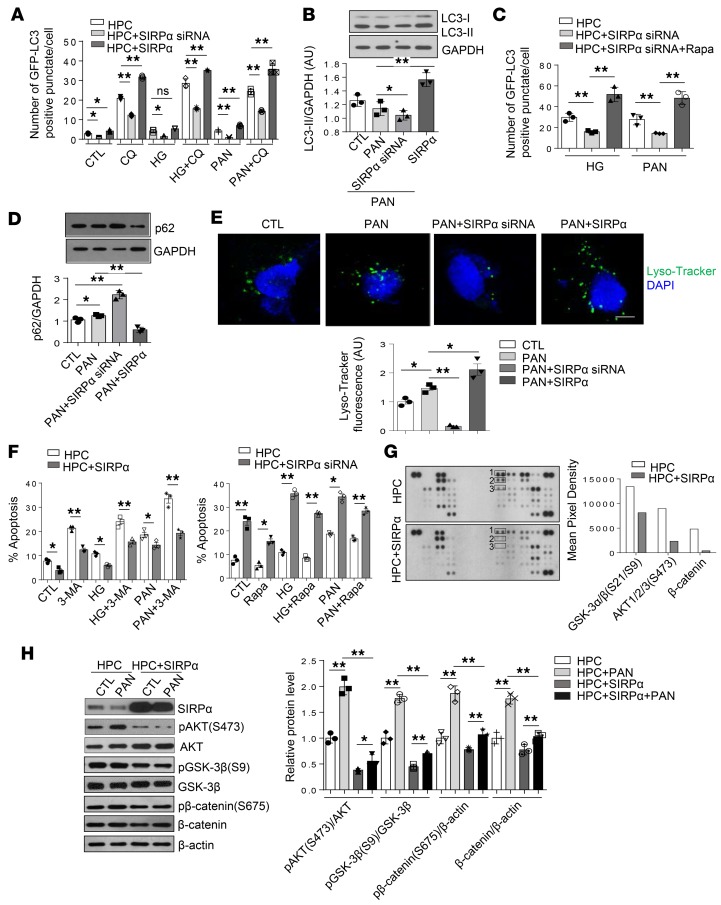
Figure 6. SIRPα critically controls podocyte stress adaptation through promotion of autophagy in vitro.
(A) Level of autophagosomes in GFP-LC3–transgenic HPCs, transfected with SIRPα siRNA or SIRPα-overexpressing lentivirus. The cells were treated with or without HG, PAN for 48 hours. Autophagosomal degradation was inhibited with CQ for 3 hours. Numbers of punctate signals in GFP-LC3–transgenic HPCs were determined by counting approximately 60 cells from 3 independent experiments. (B) Comparison of LC3-II accumulation in PAN-induced HPCs transfected with or without SIRPα siRNA or SIRPα-overexpressing lentivirus in the presence of CQ. Immunoblots are representative of 3 independently performed experiments. Histograms are quantification of LC3-II level, and GAPDH was used as internal control. (C) Autophagic flux of HPCs transfected with or without SIRPα siRNA treated with HG, PAN, and/or Rapa for 48 hours in the presence of CQ was detected. (D) Comparison of p62 accumulation in PAN-induced HPCs transfected with SIRPα siRNA or SIRPα-overexpressing lentivirus in the absence of CQ. Immunoblots are representative of 3 independently performed experiments. Histograms show quantification of p62 level, and GAPDH was used as internal control. (E) Impaired or improved acidification of lysosomes was found by staining with LysoTracker Green in podocytes transfected with SIRPα siRNA or SIRPα-overexpressing lentivirus, respectively. (F) The level of phosphatidylserine-positive cells in HPCs transfected with or without SIRPα siRNA or SIRPα-overexpressing lentivirus treated with HG, PAN, 3-MA, and/or Rapa for 48 hours. Quantification of phosphatidylserine-positive cells was determined from 3 independent experiments. (G) Detection of kinase phosphorylation in HPCs and HPCs transfected with SIRPα-expressing plasmid using human phosphokinase arrays. Rectangles 1–3 highlight p–GSK-3α/β (S21/S9), p–Akt1/2/3 (S473), and β-catenin, respectively. The levels of p-GSK-3α/β (S21/S9), p–Akt1/2/3 (S473), and β-catenin were quantified using ImageJ software and are shown in the histograms. (H) The effect of SIRPα overexpression on autophagy through targeting p-Akt, Akt, p–GSK-3β, GSK-3β, and β-catenin. Immunoblots are representative of 3 independently performed experiments. Histograms are quantification of protein level from 3 independent experiments. Scale bar in E: 10 μm. Data in A–F and H represent mean ± SEM, and P value was analyzed by ANOVA with Tukey-Kramer test. *P < 0.05, **P < 0.01.

