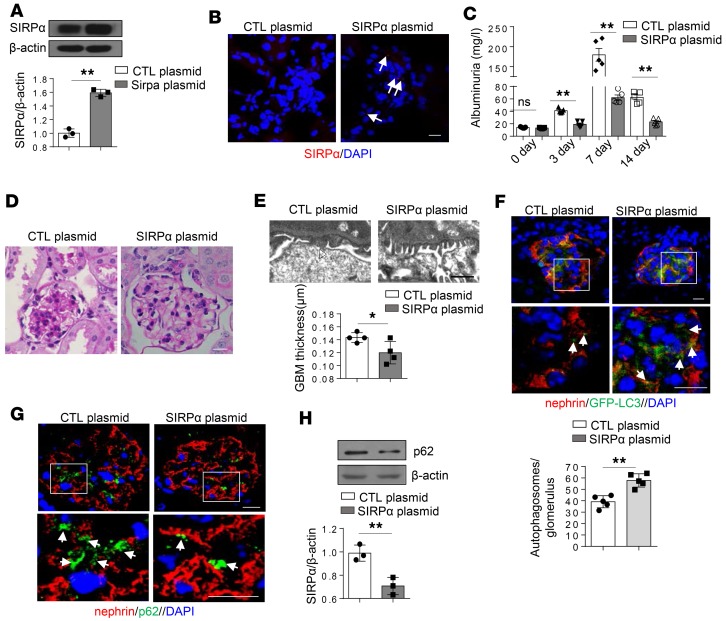
Figure 9. Overexpression of SIRPα reverses PAN-induced proteinuria and renal pathological damage through promotion of autophagy.
(A) Western blot analysis of SIRPα in mice administered SIRPα-expressing plasmid (SIRPα plasmid) or control plasmid (CTL plasmid) following PAN treatment. Immunoblots are representative of 3 independently performed experiments. The histogram represents statistical results from 3 independently performed experiments. (B) Detection of RFP-SIRPα in glomerulus. (C) Proteinuria (mg/l) content, within 24 hours, of mice treated with PAN. n = 5 mice of each group. (D) PAS staining of kidney tissue sections in mice treated with PAN. (E) SIRPα-overexpressing mice show less foot process fusion by electron microscopy (open arrowhead indicate fused foot processes); scale bar: 1 μm. Histogram represents quantification of GBM thickness (n = 4). (F) GFP-LC3–positive autophagosomes in mice treated with PAN. The histograms represent relative levels of autophagosomes in each group. Each group had 5 mice, and at least 8 glomeruli were analyzed in each mouse. (G) Accumulation of p62 in mice treated with PAN. (H)Western blot analysis of glomerulus p62 in mice treated with PAN. The histogram represents statistical results from 3 independently performed experiments. Data in A, C, E, F, and H represent mean ± SEM, and P value was analyzed by 2-tailed Student’s t test. Scale bars in B, D, F,and G: 10 μm. *P < 0.05, **P < 0.01.

