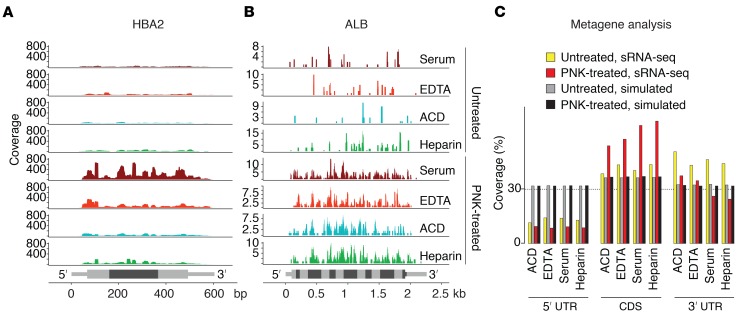
Figure 2. Read distribution of ex‑mRNA reads across the full-length mRNA transcripts.
(A and B) Read coverage for the hemoglobin A2 transcript (A) and the albumin transcript (B) by sample type for untreated and T4 PNK end-treated samples. Exon boundaries (HBA2: 3 exons, ALB: 15 exons) are indicated by alternating intensities of gray, and UTRs are distinguished from CDS by thinner bars. (C) Metagene analysis with relative read coverage (percentage) across 5′ UTRs, CDSs, and 3′ UTRs for untreated and PNK-treated samples as well as corresponding data obtained after 100 random simulations (across an average of 2342–3500 captured transcripts for untreated samples and an average of 12,789–16,487 captured transcripts for PNK-treated samples, depending on sample type). Shown are results from n = 6 individual samples per condition.

