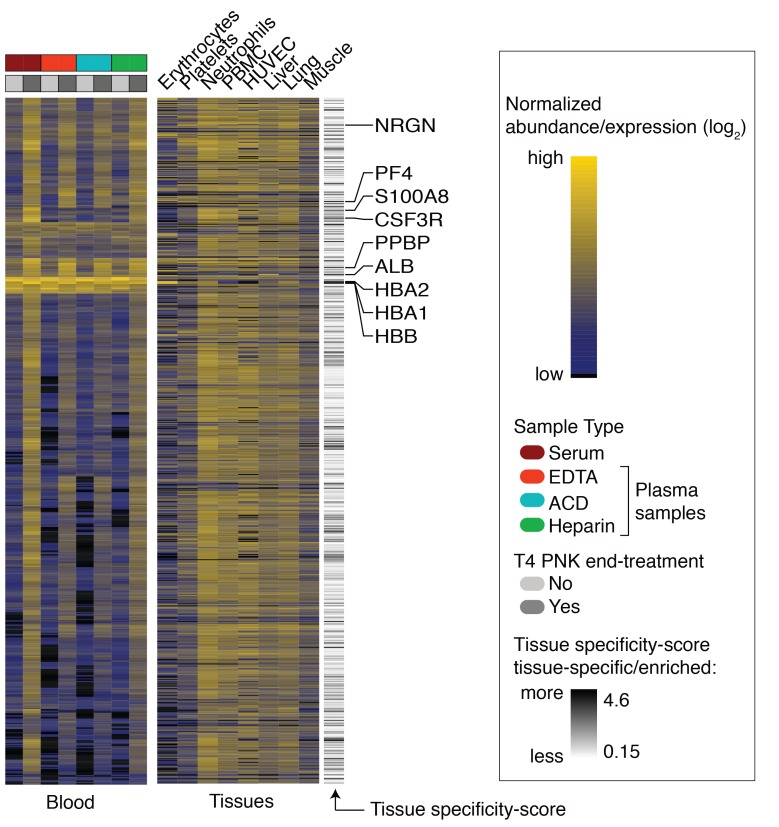
Figure 3. Tissue sources of ex‑mRNAs.
Heatmap with the top the 821 most abundant ex-mRNAs in circulation for untreated and PNK-treated samples (left), together with the corresponding expression in selected cells or tissues (right). Selected tissue-specific/enriched mRNAs are labeled together with the tissue specificity score. Shown are results from n = 6 individual samples per condition. Tissue and cell RNA-seq data used for the tissue heatmap are listed in Supplemental Data 6.

