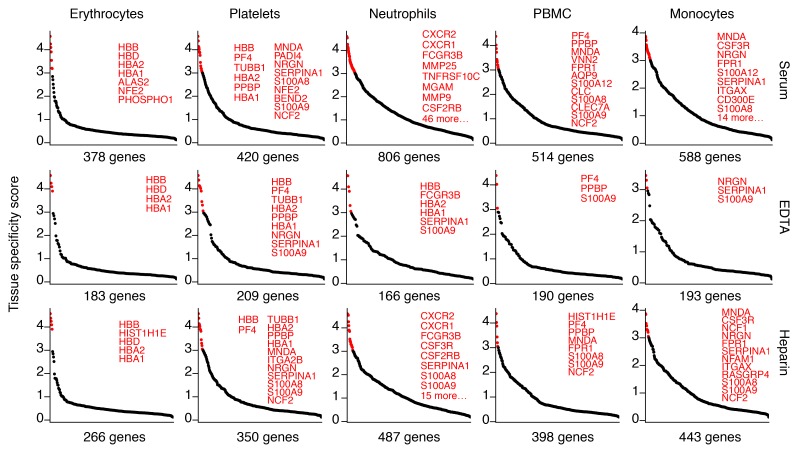
Figure 4. Top expressed transcripts from hematopoietic tissues captured in circulation.
The 1000 most abundant cellular mRNA transcripts (excluding mRNAs encoded on the mitochondrial genome) from the selected cell types that collected 5 unique reads in at least 3 of the 6 donors per sample type were considered captured. The captured transcripts (x axis) were ordered in descending order by the tissue specificity score (TSS; y axis). Transcripts with a TSS greater than 3 are highlighted in red and listed, space permitting. Shown are results from n = 6 individual samples per condition. Tissue and cell RNA-seq data used for TSS calculation are listed in Supplemental Data 6.

